
Midterms, Healthcare, and Medicare for All – Part Two
Part two of three: How other countries do it
Last week in “What we spend on healthcare and what we get,” I looked at what we pay relative to other OECD countries, what kind of outcomes we achieve, and what kind of access we have. My conclusion is that as a country we pay considerably more than our peers, do not get better outcomes in the conventional areas of measurement, and have less access to care.
The question for this article is: How do our peers deliver more care and better outcomes for less money?

In the interest of having a manageable discussion, I have chosen to borrow heavily from the Commonwealth Fund’s profiles of four different countries: France, Switzerland, Australia, and Japan. As you can see from the chart below, these are four countries that achieve some of the best health outcomes at the lowest price. (Source: OECD, Health at a Glance 2025)
Each country has its own way of managing its healthcare system. What they all share is that they all provide universal healthcare coverage to all their citizens.
Each country also uses a different mix of public, private, and nonprofit institutions to manage their system. Some are quite centralized; others are more decentralized. The conclusion is that there is no single answer to how to design a program.
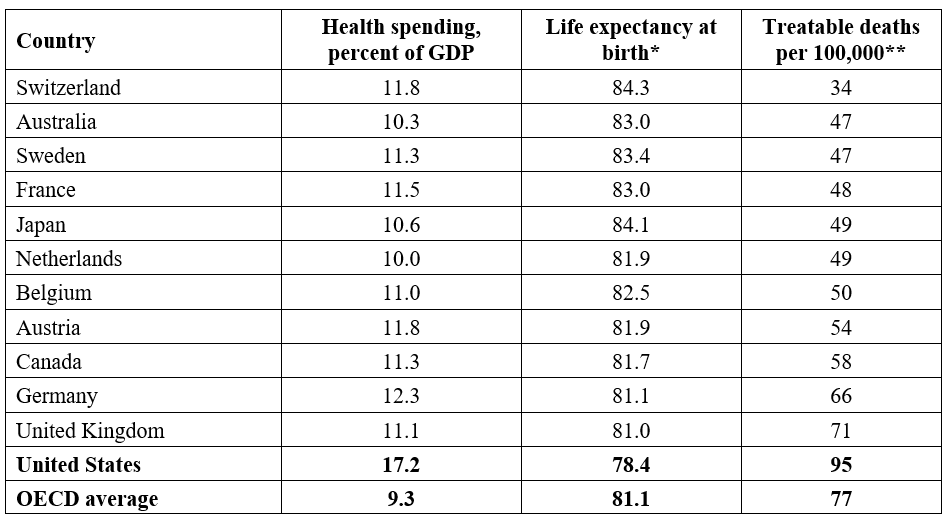
*While life expectancy at birth is a common comparator, I want to note that life expectancy doesn’t differentiate between causes of death. Therefore, other causes like guns, car accidents, drug overdoses, diet, and exercise habits contribute.
**Treatable mortality counts deaths that timely medical care should have prevented. It is the closest thing available to a direct measure of how well a health system works, because it isolates what doctors and hospitals can actually influence.
Japan
Program: Coverage is universal in Japan and anyone living in the country for three months or more must enroll. The program is administered through more than 3,000 insurers sorted into three categories: employment-based plans covering roughly 60 percent of the population, residence-based national insurance for everyone outside the workforce, and a separate program for people 75 and over. Your plan is a function of your job, your age, and where you live. Prices are set centrally by the Ministry of Health, which publishes a single fee schedule covering more than 100,000 services and drugs every two years.
Funding: 87% of the program funding is public, 11% is from patient copays, and the balance is from supplemental insurance. A monthly ceiling caps what a household can owe. Out-of-pocket spending came to 12.2 percent of total health expenditure in 2023, below the 19.3 percent average for high-income countries.
One notable observation: Japan provides a significant amount of care in the hospital setting. Patients go straight to hospitals for minor complaints, and hospitals do work that other countries administer in outpatient settings. As a result, Japan has 12.5 hospital beds per 1,000 people against an OECD average of 4.2, and the average general hospital stay was 16 days in 2023, more than twice the OECD average.
One weakness: Like other countries, Japan has shortages of medical care in rural areas. The hospital treatment preference is also impeding the development of outpatient community-based care.
Australia
Program: Australia has a system, coincidentally called Medicare, that functions like U.S. Medicare except that it covers all citizens and permanent residents. Medicare provides a Benefits Schedule of all required services and a related fee schedule. Also, much like U.S. users of Medicare, 55 percent of the population maintains a private supplemental insurance policy to cover things excluded by the program as well as access to private hospitals.
Funding: Funding is generated by general taxation plus a Medicare levy of 2 percent of taxable income, reduced or waived for low earners. Patients have greater copays than in most peer countries, with out-of-pocket spending reaching 15.3 percent of total health spending in 2022, above the 13.2 percent average for high-income countries. Safety nets cap the exposure. Once a patient's out-of-pocket costs pass an annual threshold, Medicare covers 80 percent of additional eligible outpatient costs.
One notable observation: Australia encourages citizens with tax incentives to buy private insurance as a supplement to Medicare. The logic is to relieve some of the strain on the central system.
One weakness: Healthcare providers are free to bypass Medicare and bill patients directly at a higher rate. As a result, the cost and importance of the supplement portion are growing concerns. Wait times for elective surgery are also long and increasing.
France
Program: Universal health insurance covers every legal resident as well as migrants who have been in the country more than three months. It is administered through nonprofit funds organized by profession and geography rather than chosen by the individual, and the Ministry of Health governs the system centrally. Prices are negotiated nationally between the state and the physician unions and then apply everywhere. Most residents carry supplementary insurance to cover what the state program does not.
Funding: The program is funded almost entirely from taxes as well as employer contributions based on payroll. There is no employee contribution. If you lose your job, your coverage continues and the government pays the employer's share. Public funding accounted for 75.4 percent of health spending in 2022, private insurance for 15.7 percent, and patient copays covered 8.9 percent.
One notable observation: The French system has a highly simplified administrative process. Each medical process has a single medical code, a single price, and one payment process via a single healthcare card that each citizen has. The practical result of this simplification is that a small practitioner’s office does not require any administrative staff.
One weakness: Like Japan, the French are struggling with rural medical deserts. There is also a growing level of dissatisfaction with the cost of and disparities among supplement plans.
Switzerland
Program: Unlike its peers, Switzerland manages its universal healthcare program entirely through a highly regulated private marketplace. Every Swiss resident is required to buy basic insurance from a private insurer. The federal government defines the minimum benefit package, insurers must accept every applicant, and hospitals are supervised by local government. Premiums are managed locally and can vary somewhat by policy chosen. Employers have no role in the program.
Funding: Premiums cover 45 percent of spending, 23 percent comes from general taxation, 9 percent from supplementary private insurance, with the remainder covered by patient copays. Children under 18 are exempt from the deductibles and hospital fees. Government subsidies of insurance premiums are income-based.
One notable observation: The Swiss system is the closest to the U.S. system in its reliance on private insurers.
One weakness: It is the second most expensive system with the highest out-of-pocket costs among the peer countries.
How we spend more while getting less
As outlined in Part One, we spend more in virtually every category of comparison.
Higher prices for the same service.
Higher prices for the same drugs.
Administration. The U.S. spends more of its health dollar on billing, coding, and insurance paperwork than any peer country.
Litigation and defensive medicine. Estimates are dated, but the most reliable are that we spend approximately 2.4 percent of healthcare spending here. Although comparable data are not gathered by the peer group, a survey of liability awards suggests that it is a much smaller component of their costs.
Nonclinical staff. Management layers inside hospitals and insurers have grown steadily over the past few decades as a percentage of clinical staff delivering care.
Higher salaries. U.S. clinical staff earn significantly more than their peers.
Why we spend more
The lower spending and better outcomes abroad are correlated with systems that are universal and more centrally managed than ours. Although they all have different variations, to a greater degree than we do they all employ tools such as a single public payer, negotiated prices, defined-benefit packages, and a mandate that everyone be covered.
While I understand that correlation does not prove causation, I think it is clear from these examples that the active management of universal healthcare and the employment of the many levers that such a system makes available can achieve lower costs without sacrificing outcomes.
Next week: Part three in the series: what U.S. reforms should candidates be considering?