Education Research
Explanation of source links:
Throughout the research below, you will find links of three types. The first and most frequent type is to primary sources such as governmental agencies. The second is to nonprofit groups that generally use government data or their own research to support their philanthropic mission. We have tried to use the least biased of these, or when in doubt, we have identified their bias. The third is to articles in periodicals or newspapers that we find to be of interest. These are not meant to be construed as original sources, and in some cases may not be accessible, depending on a reader's frequency of prior visits to the linked periodical or newspaper.
What is the actual state of primary and secondary education in the US?
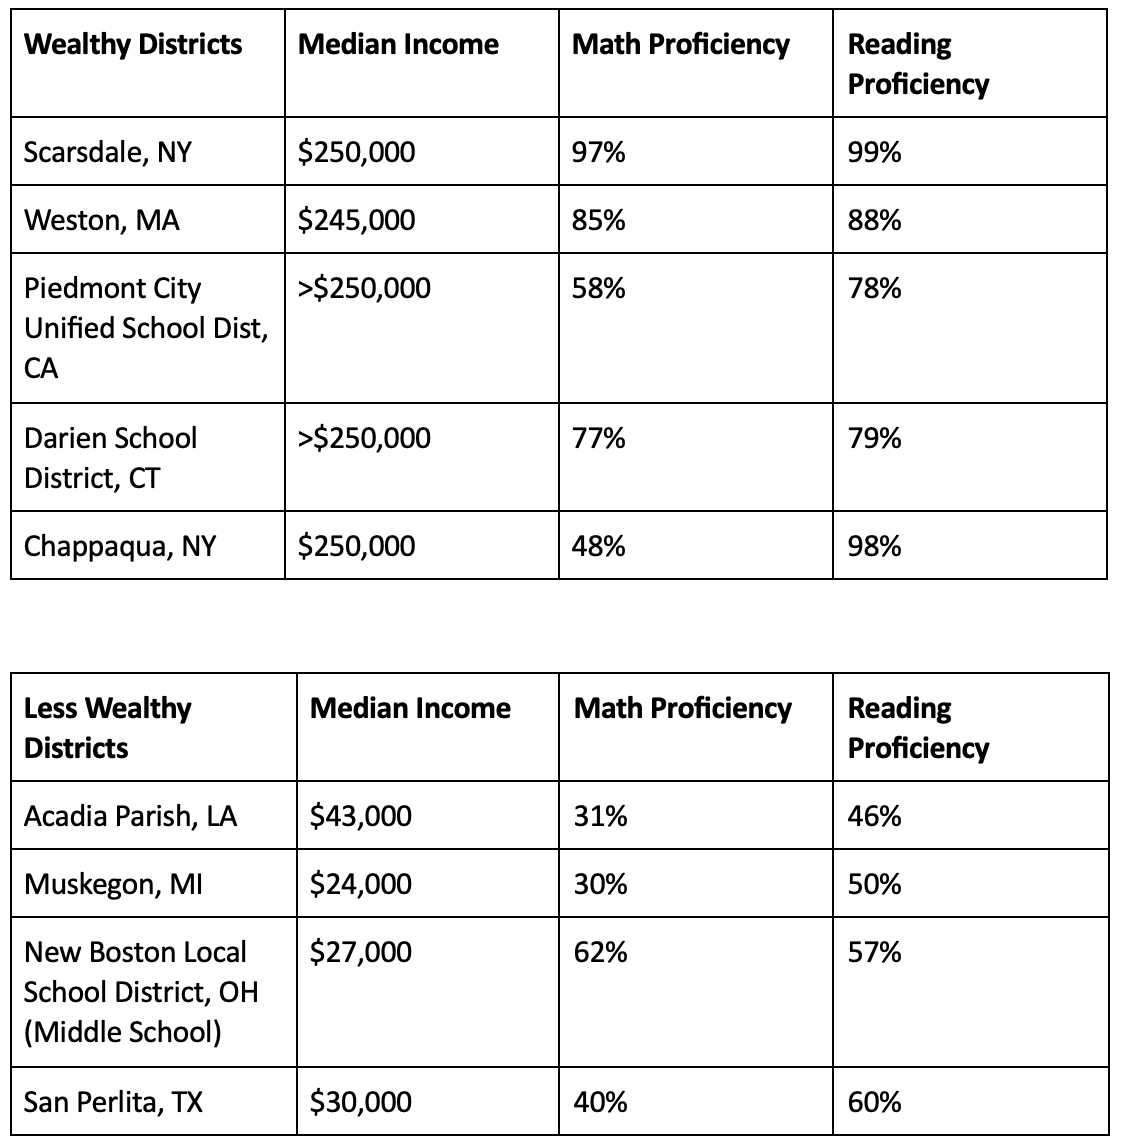
It is oversimplifying and misleading to generalize about US education as a monolithic phenomenon. In fact, test results vary dramatically across different US school districts, which is primarily a function of wealth.
Looking at proficiency rates for high school students in random samples of wealthier and poorer districts, it is easy to see a correlation between wealth and proficiency. These test results were compiled by US News & World Report.
So what do we know about education in poor communities?
Based on over 200 million standardized math and reading tests given to third- through eighth-graders nationwide between 2009 and 2012, research led by Sean Reardon of Stanford found that “school districts with the highest concentrations of poverty score an average of more than four grade levels below children in the richest districts.” Stanford University’s Educational Opportunity Project (2016), also worked on by Reardon, found that by fourth grade, students in wealthier school districts were typically two to three grade levels ahead of their peers in poorer districts. This gap widened as students progressed through school, with some wealthier students four to five grade levels ahead by eighth grade.
Why do poor communities perform worse than their wealthy counterparts?
Schools in poor communities struggle with several disadvantages that affect the quality of education. For example, they have difficulty recruiting the most skilled teachers, classes are more likely to be interrupted by disruptive behavior, school days are shorter, and recess and other athletic activities are often unavailable, as are art and music programs and advanced placement courses. The research conducted by Sean Reardon found many other factors at play, including the absence of preschool, the trauma of poverty, the lack of tutors, whether parents read to their children and supervise homework, and the emotional fallout from violence in a neighborhood.
In addition to these challenges, large city districts spend more on bussing programs and have lower-quality buildings, playgrounds, athletic facilities, and computers. They generally have more children who speak English as a second language (ESL) and more children with learning disabilities.
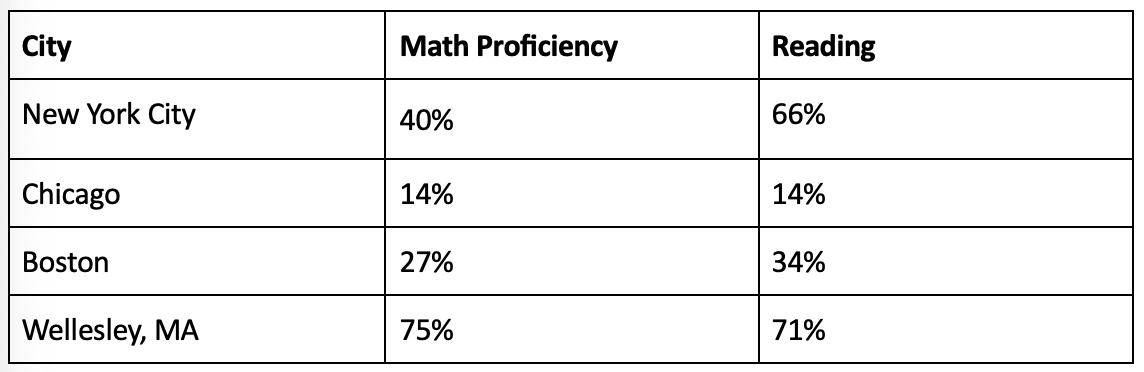
For example, to quote from the Boston Public Schools website, “We are proud to be one of the most diverse school districts in the nation. Nearly one in every two students speaks a language other than English at home, and our students come from 139 different countries. One in five BPS students has a disability, and half are economically disadvantaged.” Clearly, Boston has a larger burden than do smaller, wealthier communities. In Wellesley, MA, only 2.8% of students are ESL, 5.8% are economically disadvantaged, and 17.2% have disabilities.
Large city public schools also face greater managerial and political challenges. It is far more difficult to manage districts with the size, diversity, and complexity of Chicago (323,000 students) and NYC (937,000 students) than those like Wellesley, which has only 4,069 students and is wealthier and more politically homogeneous.
Here are the high school proficiency rates for three large city public school systems, and Wellesley:
Do poor communities always have fewer budgetary resources than wealthy communities?
The answer is nuanced, but, generally, yes. Spending per student in wealthier communities ($26,291) is almost one and a half times the nation-wide average of $19,973 per student. At $19,973, the US is the second-highest among the 40 developed nations in the Organization for Economic Co-operation and Development (OECD).
The upper and lower ends of the spectrum are important to understanding the average, as they give a sense of the disparity in investment. We arrive at an average of roughly $20,000 not because the whole country invests roughly $20,000, but because some invest closer to $30,000 and others invest closer to $10,000.
In 2024, the states with the highest per-pupil spending were:
New York: $29,873
District of Columbia: $27,425
New Jersey: $25,099
Vermont: $24,608
Connecticut: $24,453
In contrast, the states with the lowest per-pupil spending were:
Utah: $9,552
Idaho: $9,670
Arizona: $10,315
Oklahoma: $10,890
Mississippi: $10,984
Local funding, mainly from property taxes, averages 44% to 45% of US K-12 public school budgets, ranging from 3.7% in Vermont to 63.4% in New Hampshire in 2020–21. Wealthier districts, like those in New York’s suburbs, can generate up to 87% locally, raising $20,000 per pupil, while low-income areas may raise only $3,000. Thus, high-property-value areas can fund better facilities and programs. Federal and state education funding is intended to compensate for these local disparities, with varying degrees of success.
Federal funding averages 11% to 13.7% of K-12 budgets, and peaked in 2021–22 due to COVID-19 relief. It ranges from 4% in New York to 23.2% in high-poverty Texas districts, with per-pupil funding ranging from $1,473 in Utah to $4,424 in Alaska. Federal programs like Title I and the Individuals with Disabilities Education Act (IDEA) target low-income and special-needs students; high-poverty districts sometimes receive up to 75% of their budget from these programs. Federal funds are categorical and fluctuate with economic conditions.
State funding, from income and sales taxes, averages 46% to 47% of K-12 budgets, varying from 18.2% in New Mexico to 63.4% in Vermont in 2020–21. State formulas adjust for student needs and local revenue, providing up to 40% in New York’s low-resource districts but only $500 per pupil in wealthy ones. Progressive funding models aim to reduce local disparities, but economic cycles can destabilize state contributions, affecting resources.
Particular countries that set an example:
Japan, Germany, Canada, and Estonia all provide sample solutions for the US. Each of these countries approaches the administration of education differently from the US.
In Japan, education is centrally controlled and all students, rich or poor, receive the same public access. Estonia uses a similarly centralized system, allocating resources based on need, prioritizing schools with disadvantaged students. In Germany and Canada, education is administered by state and provincial and funding is standard across every locality. All four countries consistently score high on the Programme for International Student Assessment (PISA) evaluation.
In Japan, all citizens enjoying the same access to primary education programming, regardless of location. Japanese schools also emphasize the development of emotional intelligence, provide “safety nets” for all students, and provides free early childhood education.
In Germany, every child is entitled to education and daycare beginning at age one. Kindergarten is provided for children ages three to five, and most kindergartens offer full-day services. Germany has also greatly expanded its support for immigrant students, providing greater language training and academic support.
Canada not only ranks at the very top of PISA rankings, but has low disparities in scores across socioeconomic, ethnic, and racial lines. Although results and practices differ somewhat across provinces, Canada has generally increased early childhood education, childcare services, and support for at-risk students. Canadian schools are creative in their use of technology and teacher training, experiential learning, and career-focused programs. They have also implemented major reforms to improve basic literacy and math skills.
Estonia is like Japan in its centralized funding, like Canada in its emphasis on teacher training (mandatory master’s degrees), and like Germany in its investment in early childhood education. All four score well in terms of performance variation across socioeconomic status, with variation percentages well below the OECD average of 15%. Estonia’s score in this regard is improved by its delaying of academic tracking until age 15-16. Tracking students earlier, like Germany does at around age 10, exacerbates socioeconomic disparities.
In summary, there are two primary approaches that set these countries apart from the US: first, little or no variation in education funding across communities, and second, far more emphasis on early childhood education and social/emotional learning.
What is the history of reform efforts in the US?
Early in his first term, President Ronald Reagan established the National Commission on Excellence in Education to assess the state of education in the US and to recommend an approach to improving it. In 1983, the commission presented its findings in a report entitled “A Nation at Risk: The Imperative for Educational Reform”. The findings of the commission were “grim,” if not devastating. The report began with the alarming statement, “Our nation is at risk.” It went on to say, “If an unfriendly foreign power had attempted to impose on America the mediocre educational performance that exists today, we might well have viewed it as an act of war. As it stands, we have allowed this to happen to ourselves.”
The report provided considerable indicating that test scores were rapidly declining, teachers were underpaid and under-trained, turnover was at destructive levels among educators, 23 million Americans were functionally illiterate, average high school standardized test scores were lower than they were in 1957, and only one-fifth of 17-year-old students had the ability to write a persuasive essay. The commission warned that even at that time, the US ran the risk of losing its technological superiority due to a failing public school system. In this respect, it had considerable foresight: “Technology is radically transforming a host of other occupations. They include healthcare, medical science, energy production, food processing, construction, and the building, repair, and maintenance of sophisticated scientific, educational, military and industrial equipment.”
The commission made several recommendations which are still relevant 40 years later:
Increase the quality the quality of English, mathematics, science, social studies, computer science, and foreign language content.
Raise standards across the board, increase the frequency of testing, and upgrade outdated “textbooks and other tools of learning.”
Lengthen the school dayand year to match other developed countries, meaning seven-hour school days and 200 to 220 school days a year.
Increase our focus on children who learn differently.
Raise standards for teachers, increase salaries accordingly, and adopt 11-month contracts to allow more time for professional development, programs for students with special needs, and curriculum development.
Following the commission’s report, President Reagan appointed William Bennett as Secretary of Education and assigned him the responsibility of addressing its recommendations. Bennett and the National Education Association (the national teachers’ union) quickly reached a standoff, with the NEA attacking the report as an assault on teaching and public education and having traditionally resisted any talk of merit or performance pay. Bennett, in turn, blamed the union as a prime cause of the decline of public education. Sadly, the reform recommendations of the commission were largely unimplemented—with the exception of a small increase in teacher compensation.
George H. W. Bush proclaimed his desire to be the “Education President.” He convened a summit of the nation’s governors, including future President Bill Clinton (who already had credentials as an education reformer in his state of Arkansas). Clinton, a leading voice at the summit, pushed for specific goals for reducing the disparity in achievement levels among children of different races, reducing high school dropout rates, and increasing the percentage of high school graduates going on to college.
Campaigning for president in the year 2000, George W. Bush also embraced education reform, highlighting the “soft bigotry of low expectations” that he thought characterized low teaching standards. In 2002, with the support of both Republicans and Democrats, he signed No Child Left Behind into law. The new law standardized testing nationwide and required states to quantify achievement gaps and implement plans to fix failing schools or lose federal funding.
In 2009, President Obama allocated $4 billion to an education reform program called Race to the Top. Championed by then Secretary of Education Arne Duncan, Race to the Top created a contest for the states to submit the best specific plans for using data and testing to evaluate teachers, creating new incentives for effective teaching, expanding the role of charter schools, and turning around failing schools. There would be 10 to 15 winners, all of whom would divide up the total $4 billion. The program set off a storm of reform efforts and nationwide demand by citizens from all walks of life to implement the reforms championed by the winners. It also set off fierce resistance by the American Federation of Teachers (AFT), who continued to resist the growth of charter schools, relaxation of work rules, and greater accountability of their membership.
What are Charter Schools?
Charter schools are “private” schools that receive government funding but operate independently of the school districts in which they are located. There are several different types of charter schools:
Independent charter schools are standalone operations. They’re not part of a larger organization and are often referred to as “mom and pop” charter schools. As of 2024, 40% to 50% of US charter school students attended independent charter schools.
Charter management organizations (CMOs) operate more than one charter school and control every aspect of operations, including facilities, personnel, and curriculum. They can be nonprofit or for-profit.
Vendor-operated schools (VOS) are run by companies that provide services under contract to at least three separate charter schools but do not directly hold the charters for the schools they serve. These vendors might be in charge of all aspects of a school operation or only specific aspects. They provide services to no more than two schools in the same charter.
Hybrid charter schools have aspects of both a CMO and VOS. Only 1% of all charter schools are hybrids.
Charter schools generally have private boards and fundraise independently. While they are responsible for meeting district education standards, they are generally free of other restrictions imposed by districts and the AFT. As a result, charter schools may have longer school days, are free to recruit and dismiss teachers based on their own standards, and are free to design classroom activities as they see fit.
Between 2010 and 2021, public charter school enrollment rose significantly from 1.8 million to 3.7 million students. This increase was driven by defection from traditional public schools, where attendance decreased by 4%. At the same time, the percentage of all public school students who attended public charter schools increased from 4% to 7%. Covid provided significant motivation for the recent shift, as it threw into sharp relief charter schools’ superior flexibility and responsiveness to a changing environment. A 2021 survey by Civis Analytics, cited by one charter school, surveyed 2,324 parents and found that 29% removed their children from public schools due to decisions about school reopenings during the pandemic. Of these, 14% switched to charter schools, 42.6% opted for online programs (including virtual charters), 19% chose private schools, and 22% transferred to other public schools.
The evaluation of charter schools is in its infancy and is challenged by many things, including the variety of school types, locations, levels of student poverty, etc. The most extensive analysis we have found was by the Center for Research on Education Outcomes (CREDO) at Stanford University. Proponents find ample evidence showing that charters outperform public schools, while opponents are equally armed with data suggesting otherwise. Having said that, charters do tend to have far more demand in their communities than seats, suggesting that the perception at least of parents is that they are often superior alternatives to their local public school. States typically place limits on the number of charters that can be issued. Often, these limits are subject to public referendums. Traditionally, the AFT has also fought charter expansion.
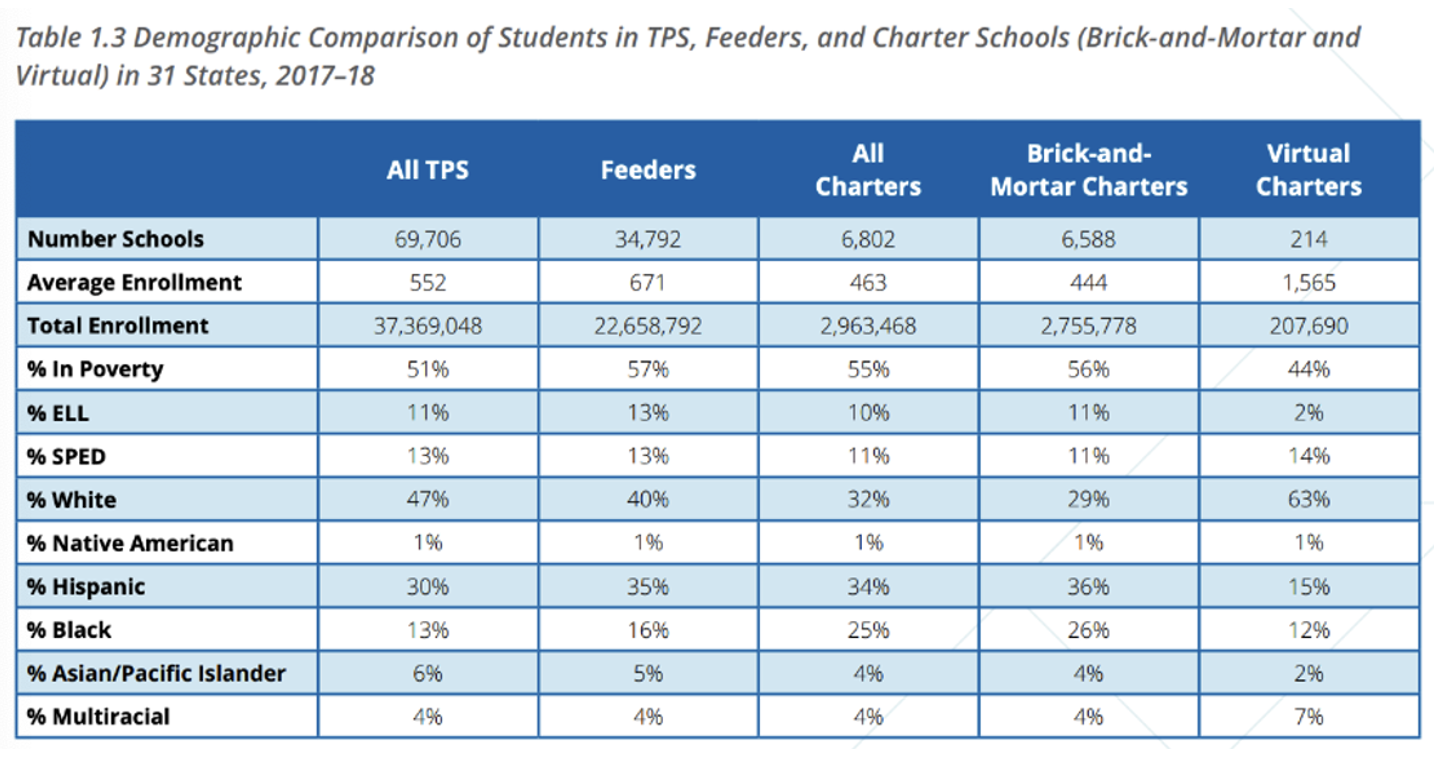
The following table, from CREDO’s National Charter School Study III, compares the profile of students attending charter schools to those in traditional public schools (TPS).