
Infrastructure Research
Contributed by Claire Kelly
Explanation of source links:
Throughout the research below, you will find links of three types. The first and most frequent type is to primary sources such as governmental agencies. The second is to nonprofit groups that generally use government data or their own research to support their philanthropic mission. We have tried to use the least biased of these, or when in doubt, we have identified their bias. The third is to articles in periodicals or newspapers that we find to be of interest. These are not meant to be construed as original sources, and in some cases may not be accessible, depending on a reader's frequency of prior visits to the linked periodical or newspaper.
What is the definition of infrastructure?
Infrastructure is defined as the physical systems that underlie the operation of a society and enable, sustain or enhance societal living conditions. The infrastructure of a nation includes transportation, communication, sewage, water, and electricity systems. These systems may be public, such as roads and sewers, or private, such as information and communication networks.
Why is infrastructure important?
In 1988, Fragile Foundations: A Report on America’s Public Works established a grading system to evaluate US infrastructure and stated that “the quality of a nation’s infrastructure is a critical index of its economic vitality. Reliable transportation, clean water, and safe disposal of wastes are basic elements of civilized society and a productive economy. Their absence or failure introduces an intolerable dimension of risk and hardship to everyday life, and a major obstacle to growth and competitiveness.”
A more recent report by the American Society of Civil Engineers (ASCE) from 2016 reiterated, “Infrastructure is the backbone of the US economy and is a necessary input to every economic output. It is critical to every nation’s prosperity and the public’s health and welfare. Each Failure to Act study demonstrates that deteriorating infrastructure, long known to be a public safety issue, has a cascading impact on our nation’s economy, impacting business productivity, gross domestic product (GDP), employment, personal income, and international competitiveness.”
Who is responsible for US infrastructure?
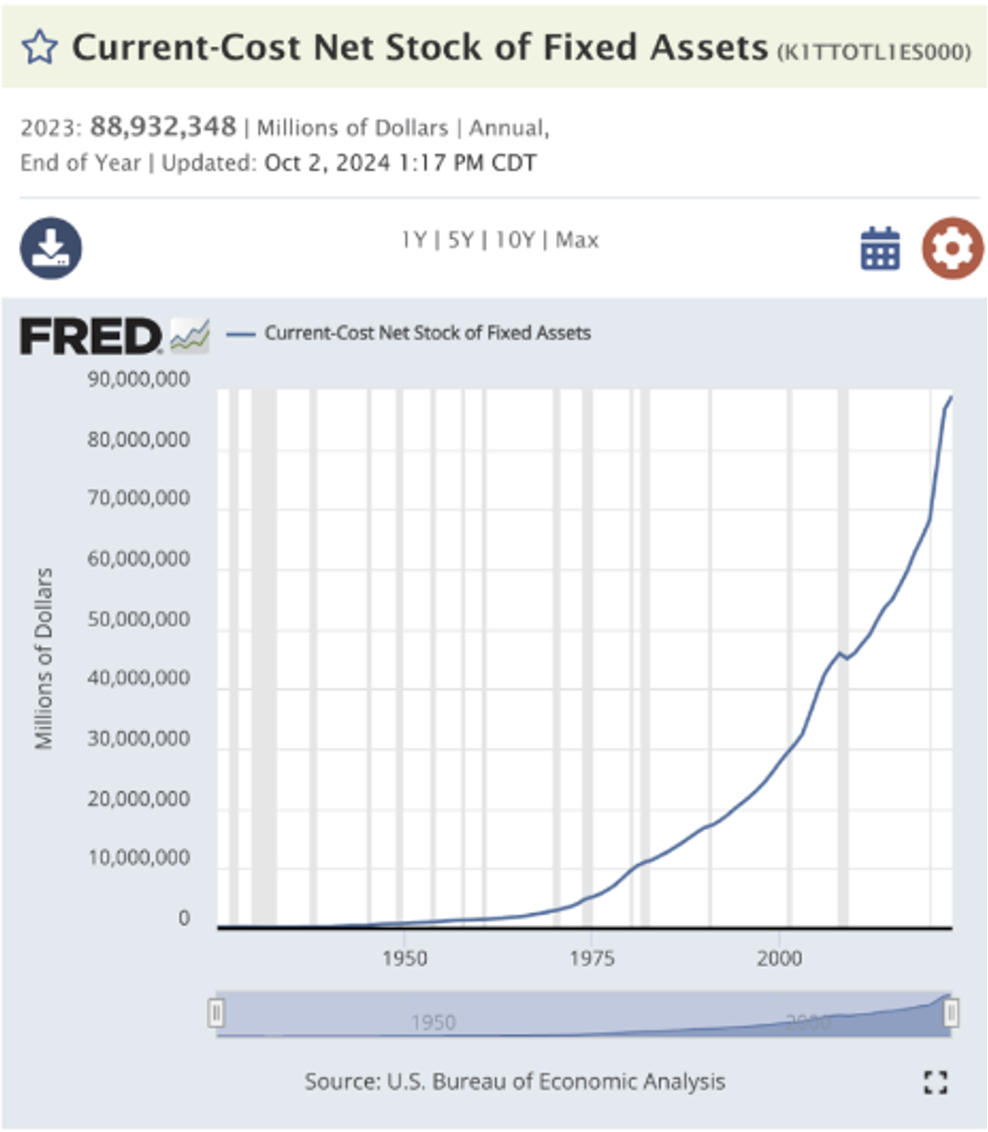
In 2023, the total value of US infrastructure was approximately $89 trillion. This included private, state and local, and federal fixed assets.
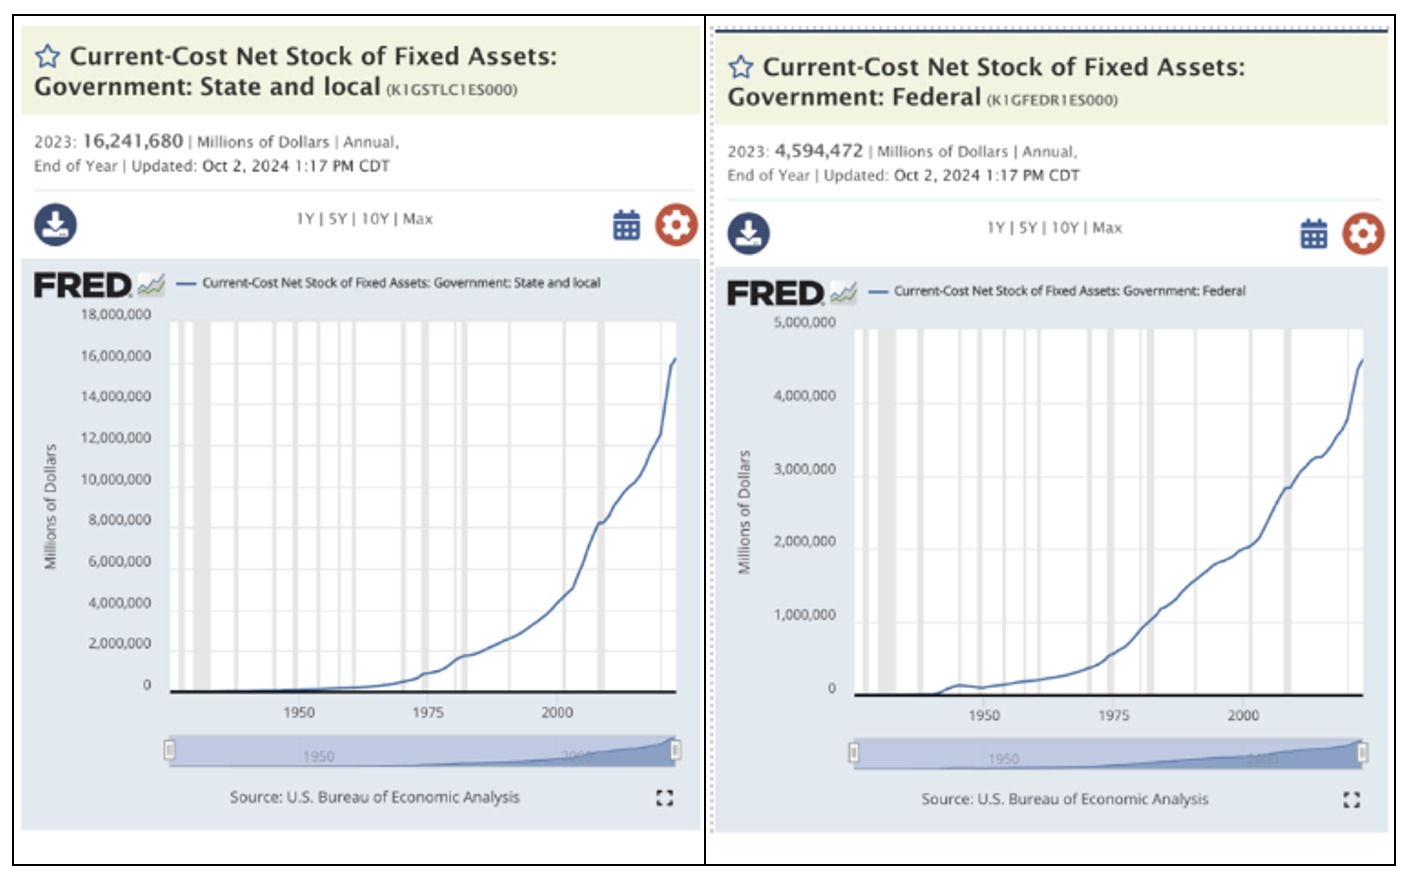
About $16 trillion of this total was owned by state and local governments, with federal ownership close to $5 trillion. The vast majority of infrastructure was private, at approximately $68 trillion.
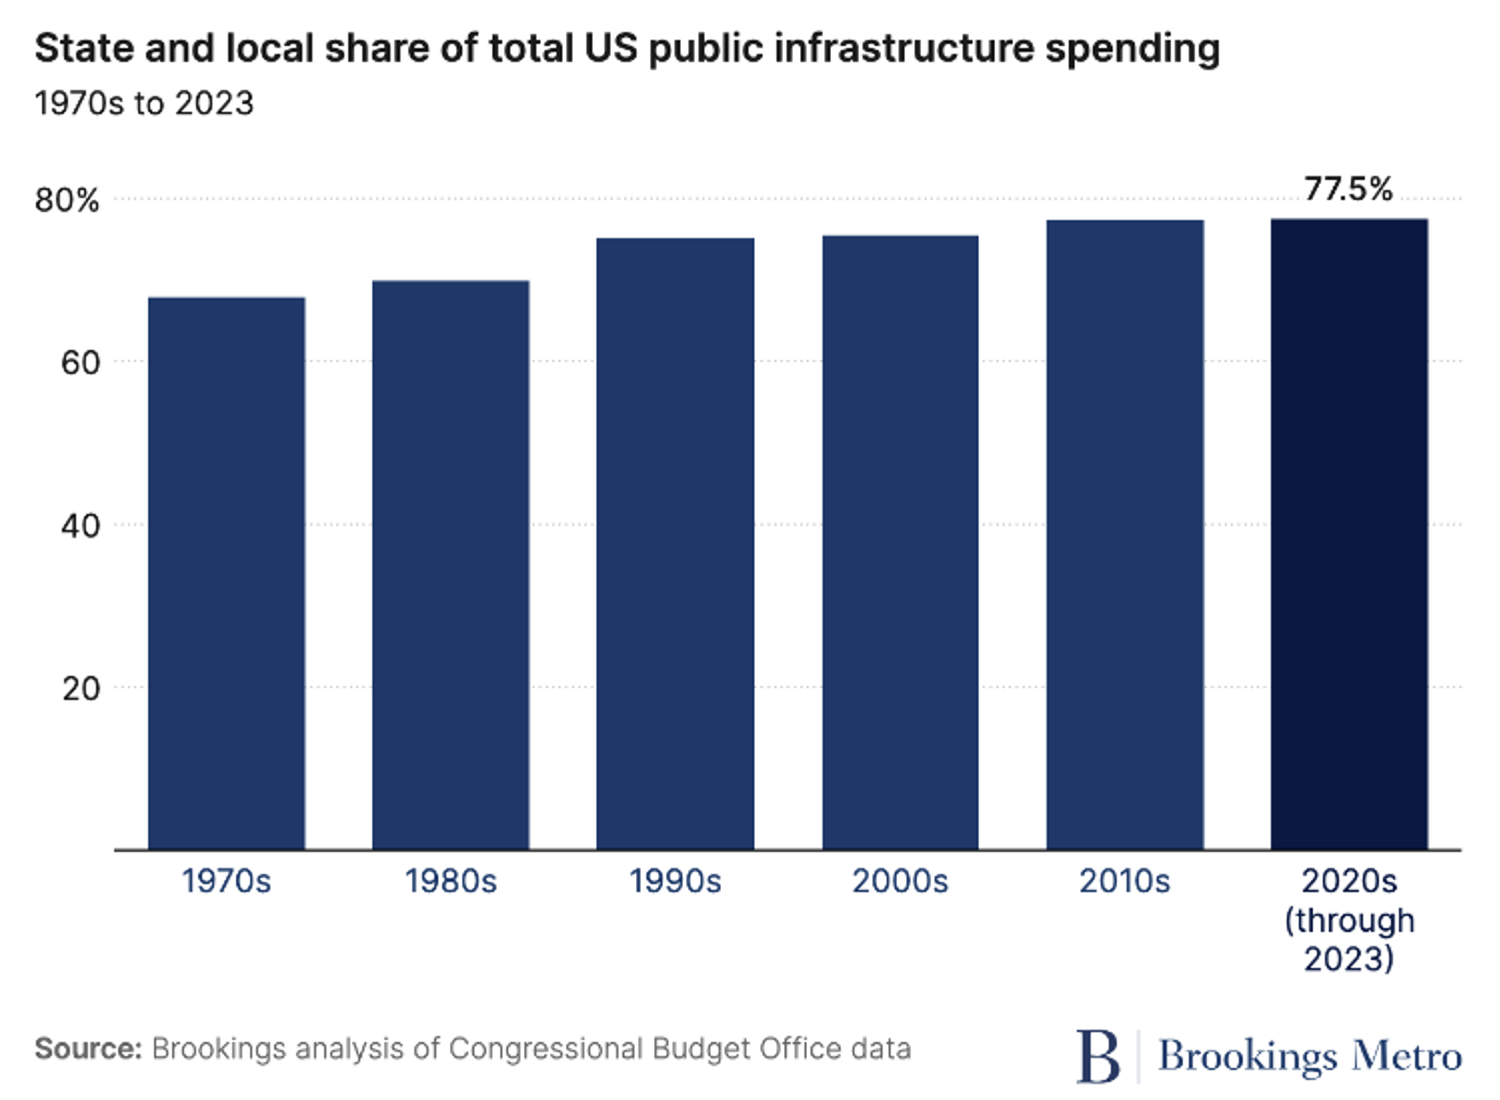
The cost of public infrastructure is shared by federal, state, and local governments, but the majority of spending comes from state and local governments. According to the Brookings Institute, state and local governments accounted for 77.5% of total US public infrastructure spending in 2020-2023.
States own most transportation, water, and sewer system infrastructure, while the federal government owns intellectual property (R&D assets) and park infrastructure.
Despite the importance of the private sector, many of the key moments in US infrastructural history have been supported by substantial federal investment. Public investment in infrastructure can be a catalyst for private investment, and federal regulations influence state, local, and private investment.
What are the key moments in the history of US infrastructure?
Energy Infrastructure: The national electrical grid powers nearly every aspect of our society. The grid was initially designed as a centralized, hierarchical system that defined producers (power plants) and consumers separately, and is now three interconnected grids that cover the country and branch out into parts of Canada and Mexico. In 2003, the Office of Electric Transmission and Distribution and the Office of Energy Assurance were created by the Department of Energy, and later merged into the Office of Electricity.
The Federal Power Commission was established in 1920, creating a federal role in the regulation of hydroelectric power production. While most dams were and continue to be owned and operated by the private sector, during the New Deal the federal government took the lead in building several large dams, such as the Hoover, Bonneville, and Grand Coulee.
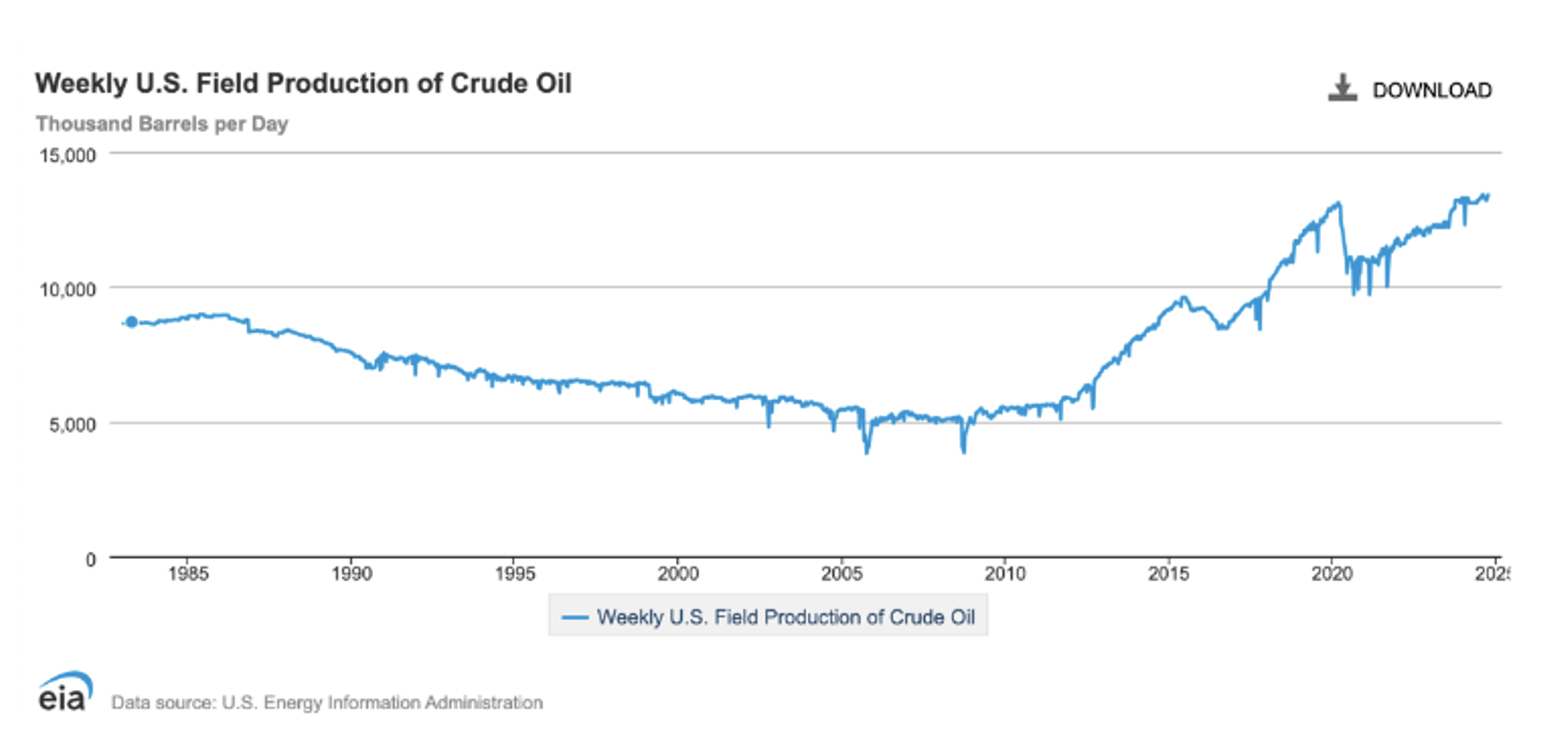
US oil production has risen sharply since the early 2000s, as charted by the US Energy Information Administration.
The nation's more than 2.6 million miles of pipelines safely deliver trillions of cubic feet of natural gas and hundreds of billions of ton/miles of liquid petroleum products each year, per the Department of Transportation. Over 50% of US oil pipelines were constructed before 1970.
Transportation Infrastructure: In the early nineteenth century, the New York legislature authorized the funding and construction of the 364-mile Erie Canal. Its success launched a boom in public-private canal construction partnerships. Although the effort was initially led by the states, ultimately the federal government participated by providing land grants and subscribing to canal company stock offerings.
In the 1840s, Congress undertook the planning for the completion of the transcontinental railroad system. The Army Corps of Engineers was responsible for the initial route surveys, and in 1862 President Lincoln signed legislation providing land and financial incentives to the Union Pacific and Central Pacific railroad companies to complete the project.
Our interstate highway system was inspired by the Reichsautobahnen, Germany’s high-speed road network. Under the Federal-Aid Highway Act of 1956, $26 billion was authorized to construct over 41,000 miles of interstate highways. Ninety percent of the funds came from the federal government, and the other 10% came from state governments. New taxes on gasoline, buses, tires, and trucks went toward a Highway Trust Fund to pay for this construction and future maintenance. Construction of the highways was a bipartisan effort that continued from the Kennedy presidency to the Carter presidency.
Information and Communications Infrastructure: In 1934, the Communications Act created the Federal Communications Commission (FCC) to organize and regulate communications by phone, telegraph, and radio. Beginning in the late 1960s, the networks that became the modern internet were largely sponsored by federal funding and developed by government agencies (Department of Defense, National Science Foundation, and NASA).
What is the state of current US infrastructure?
There are three principal organizations that evaluate the state of US infrastructure. The first is the National Council on Public Works Improvement (NCPWI), which was established pursuant to the Public Works Improvement Act of 1984. Consisting of five members appointed by the president and the Congress, the council is charged with providing an annual report on the state of American infrastructure.
The second is the ASCE, a civil engineering professional society founded in 1852, and representing over 160,000 members in 177 countries.
The third is the World Economic Forum (WEF). The WEF was founded in 1971 as a nonprofit foundation and is headquartered in Geneva, Switzerland. It is independent, impartial, and not tied to any special interests. The mission of the WEF is to “engage the foremost political, business, cultural and other leaders of society to shape global, regional and industry agendas.” The WEF published a “Global Competitiveness Report 2019” that rated 141 countries on their capacity to compete, innovate, and grow into the future.
Both the NCPWI and ASCE have routinely found that the state of US infrastructure is poor, assigning it “D” average grades since the 1980s. In 2021, ASCE’s Infrastructure Report Card gave the US an overall grade of “C-“ and the following grades in specific categories:
Bridges: C
Roads: D
Drinking Water: C-
Wastewater: D+
Dams: D
Transit: D-
Several characteristics of US infrastructure contributed to these evaluations:
The Grid: The ASCE rated US energy infrastructure a C- in 2021. According to Gretchen Bakke in her book The Grid, the number of significant power outages climbed from 15 in 2001 to 307 in 2011. Bakke uses the the U.S. Department of Energy (DOE)definition, which considers an outage “significant” when at least 50,000 customers lose power for at least one hour. Over 70% of the country’s lines and transformers are more than 25 years old, and power plants are an average of 42 years old. Similarly, 1.7 million infrastructure workers are expected to retire in the coming decade
Electricity is produced as it is used, and fluctuations in usage force utilities to continuously manage production, routing electricity to open “sinks.” Smart meters help by closely monitoring demand, yet, according to Peter Asmus (Research Director for microgrids and virtual power plants at the Climate Center), our system relies on twice as many power plants as we need due to inefficiencies.
The US grid is also unequipped to deal with the growing importance of renewable energy generation, as it was designed to accommodate large, consistent sources of electricity such as coal and natural gas plants. In the first eight months of 2024, however, renewables accounted for 24% of US electrical generation. The change in energy sources from 2012 to 2023, as monitored by the Energy Information Administration (EIA), was as follows:
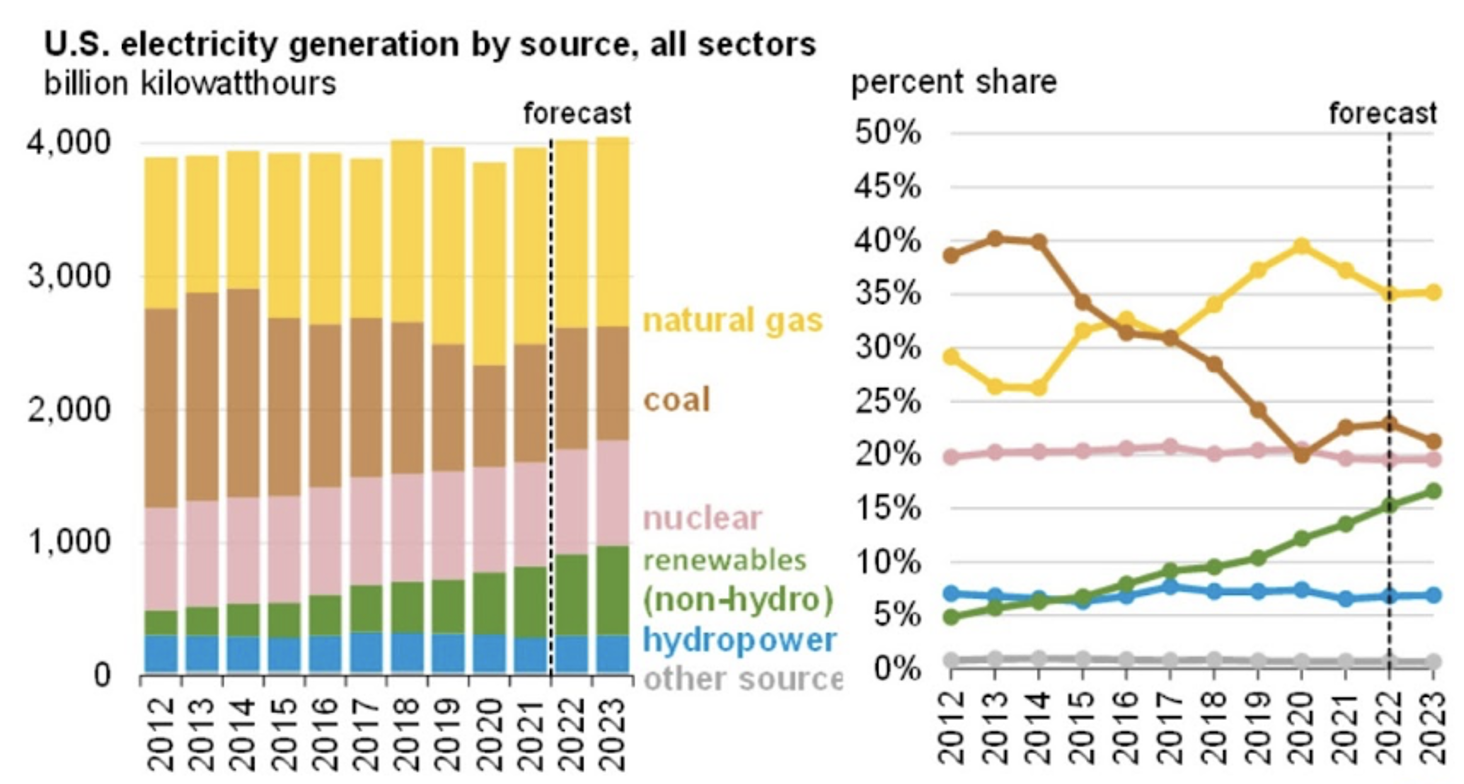
The power generated by renewable plants varies depending on the source (such as wind, sun, or water), as opposed to oil, gas, and coal plants where production can be controlled. Furthermore, peak production in places such as the Columbia River Gorge, where there are thousands of wind turbines, can exceed the capacity of our infrastructure, requiring these plants to shut down during some conditions. As a result, the grid will require a significant redesign in order to accommodate the shift to renewables necessitated by climate change.
Transportation: The US has more than 4.2 million miles of roads and bridges. In 2024, 36% of U.S. bridges require major repair or replacement, with 6.8% rated in poor condition, and the nation faces an estimated $1.1 trillion backlog in unmet highway and bridge investment needs. Despite this and the fact that public transportation is safer, cheaper, and reduces emissions, US transportation relies heavily on car ownership. As of 2023, 69.2% of U.S. workers drive alone to work. Meanwhile, about 45% of Americans still have no access to public transportation. The WEF ranked US transportation infrastructure 13th in the world as of 2019.
Water Infrastructure: The treatment and distribution of water and wastewater in the US is highly decentralized and local in nature, with approximately 156,000 public water systems in existence. Many of these systems are now approaching 60 years old, have been challenged by growing populations, and have not been able to keep up with growing public health and environmental standards. Parts of the water supply system in New York City have never been emptied for inspection because they have operated at full capacity since their installation. In 2017, the ASCE predicted that 70% of US dams would be over 50 years old in 2025. The ASCE estimates the total funding gap between now and 2040 at $152 billion, while in 2013 the Environmental Protection Agency (EPA) estimated that upgrading our water distribution systems would cost $200 billion over 20 years.
What are the implications of our deteriorating infrastructure?
Financial: Lack of infrastructure investment leads to deteriorating transportation, water, grid, and other systems and “effectively clips [an] economy’s wings,” according to S&P Global.
In their 2017Failure to Act report, the ASCE estimated that our increasingly dilapidated infrastructure could cost each household $3,400 per year in disposable income.
We lose an average of six billion gallons (about 14%) of our clean drinking water to leaks every day. The EPA estimates that the average household wastes 90 gallons of water per day due to leaks. This adds up to over 1 trillion gallons of water lost nationally each year. Buried infrastructure can be a century old, and an average of 650 water mains fail every day. Other pipelines are also aging: a 2010 explosion in San Bruno, California, that destroyed a dozen homes and killed eight people was the result of increased pressure caused by growing demand on a natural gas pipeline installed in 1956. Pacific Gas and Electric was fined $1.6 billion for violating safety standards. The lead pollution crisis in Flint, Michigan, was precipitated in part by the city’s struggle to meet high maintenance costs for aging, deteriorating water infrastructure, which led them to draw water from the local Flint River rather than from Detroit.
Power outages cost businesses in lost productivity: the 2003 East Coast Blackout cost $6 billion, equal to $60,000/hour per business. Outdated surface transportation also leads to lost productivity from daily traffic congestion. In 2014, 6.9 billion vehicle-hours of delay were caused by congestion across 470 urban areas, with projections of a 20% rise by 2020. In 2016, surface transportation delays cost an estimated $36 billion in productivity loss. When vehicle operating, safety, and environmental costs were included, the total reached nearly $147 billion. In 2023, the average US driver lost 42 hours (a full work week) to traffic congestion, an 11% increase from 2022. The cost of this lost time to the US economy was $70.4 billion.
Infrastructure and Climate: Increases in catastrophic events across the world have posed serious challenges to infrastructure. The area burned by wildfires annually in California increased fivefold between 1972 and 2018, with part of the blame falling on outdated electrical utility equipment. The last decade saw seven million acres burned, which is one and a half times larger than the average per-decade burn area since 1979. In October of 2019, Pacific Gas and Electric—which had been implicated in one of the state’s deadliest fires—chose to cut electric supply across large areas of northern California due to forecasts of strong winds after a dry summer and fall, leaving more than two million people without power.
Increasing temperatures will reduce the lifespan of asphalt, add stress to expansion joints on bridges, and cause buckling of railways. According to city-resilience plans, by 2100, about 20% of Lower Manhattan’s streets are projected to be subject to daily flooding under scenarios of sea level rise. Many transportation assets (streets, underground utilities, access ways) will be increasingly exposed.
Over 85% of the country’s 100,000 miles of levees are privately owned without a standardized system for monitoring reliability. Many are a half-century old and protect large residential developments. After Hurricane Katrina’s catastrophic flooding, $14 billion was invested in levees and floodwalls in greater New Orleans. In 2019, the Army Corps of Engineers reported that these would only provide adequate protection for another four years due to rising sea levels and the levees’ natural settling.
The 2021 Bipartisan Infrastructure Law (BIL), also called the Infrastructure Investment and Jobs Act (IIJA), allocated significant funding for levee improvements in New Orleans and other flood-prone areas across Louisiana. While there is no specific breakdown solely for the New Orleans levees, the state of Louisiana received $572.5 million for resilience projects, including $21.4 million through the Army Corps of Engineers for flood mitigation projects.
Security: Our electrical grid’s age and dilapidation make it vulnerable to cyberattacks. In January 2019, Director of National Intelligence Dan Coats testified that adversaries—particularly China and Russia—could utilize cyber capabilities to attack the grid and conduct espionage. In the spring of 2019, the first disruptive cyberattack on the Department of Energy was reported. Former Homeland Security Secretary Michael Chertoff described this vulnerability as a “real national security issue,” stating that “power and energy is the core of almost everything we do.” A 2019 Critical Infrastructure Protection report from the US Government Accountability Office outlined the actions needed to “Address Significant Cybersecurity Risks Facing the Electric Grid.” They found that other nations, terrorists, and criminal groups were increasingly capable of exploiting the vulnerabilities of our grid. The growing utilization of smart meters as part of the grid augments this threat.
Are we investing sufficiently in infrastructure?
No, but the latest trend is positive, due to the IIJA and the Inflation Reduction Act. According to a March 2025 Brookings article, “The US has seen a surge in federal infrastructure funding over the last few years, including more than $1 trillion from the Infrastructure Investment and Jobs Act (IIJA) and Inflation Reduction Act (IRA). The mix of formula funds, competitive grants, and tax credits has helped tens of thousands of transportation, water, energy, and broadband projects move forward.”
President Obama included $105 billion in infrastructure investment in the American Recovery and Reinvestment Act (ARRA) of 2009, a stimulus spending program undertaken as a catalyst for economic growth. According to Jeffrey Sachs, writer of The Age of Sustainable Development, the spending produced “few, if any” lasting results. According to Harvard professor Rosabeth Moss Kanter in her book Move, most of the funds were directed toward labor-intensive public work projects to “repair and renew” rather than “reinvent.” Since ARRA, public bus and rail transportation investment has increased due to maintenance spending, but capital investment has dropped.
How does our spending compare with other developed nations?
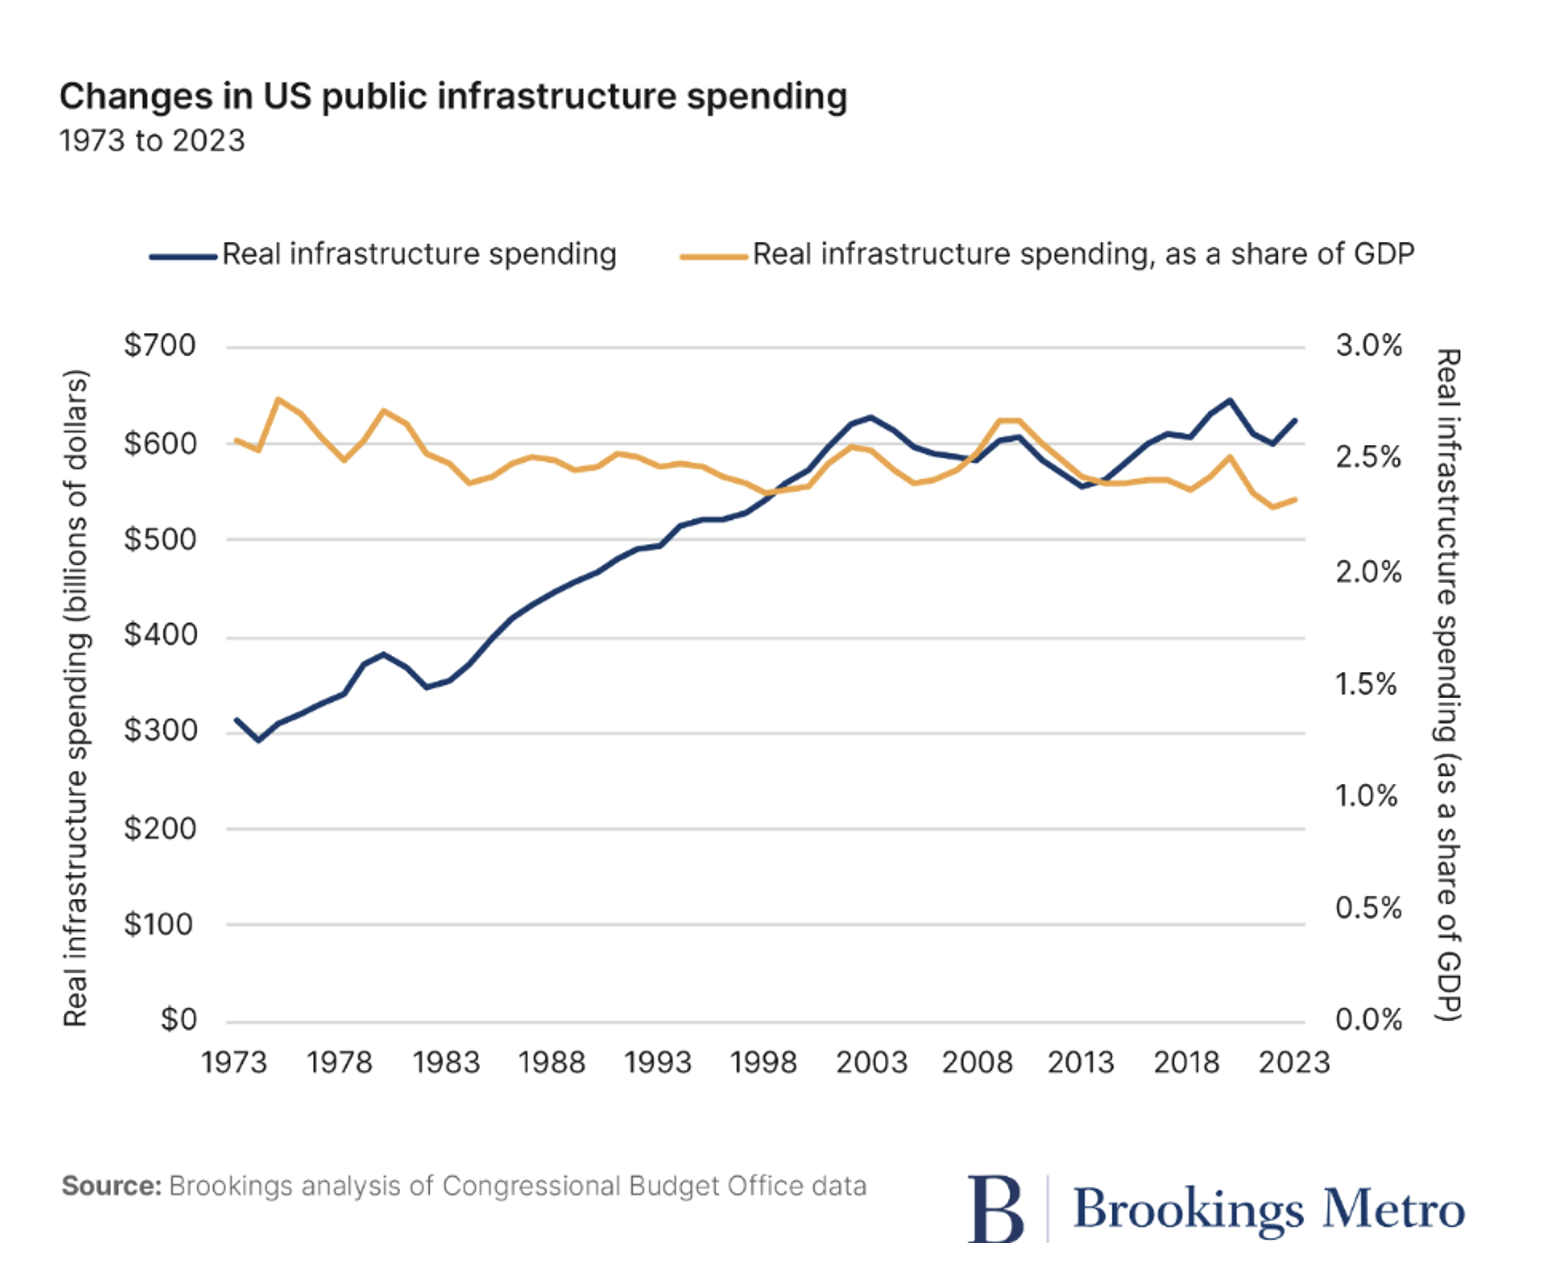
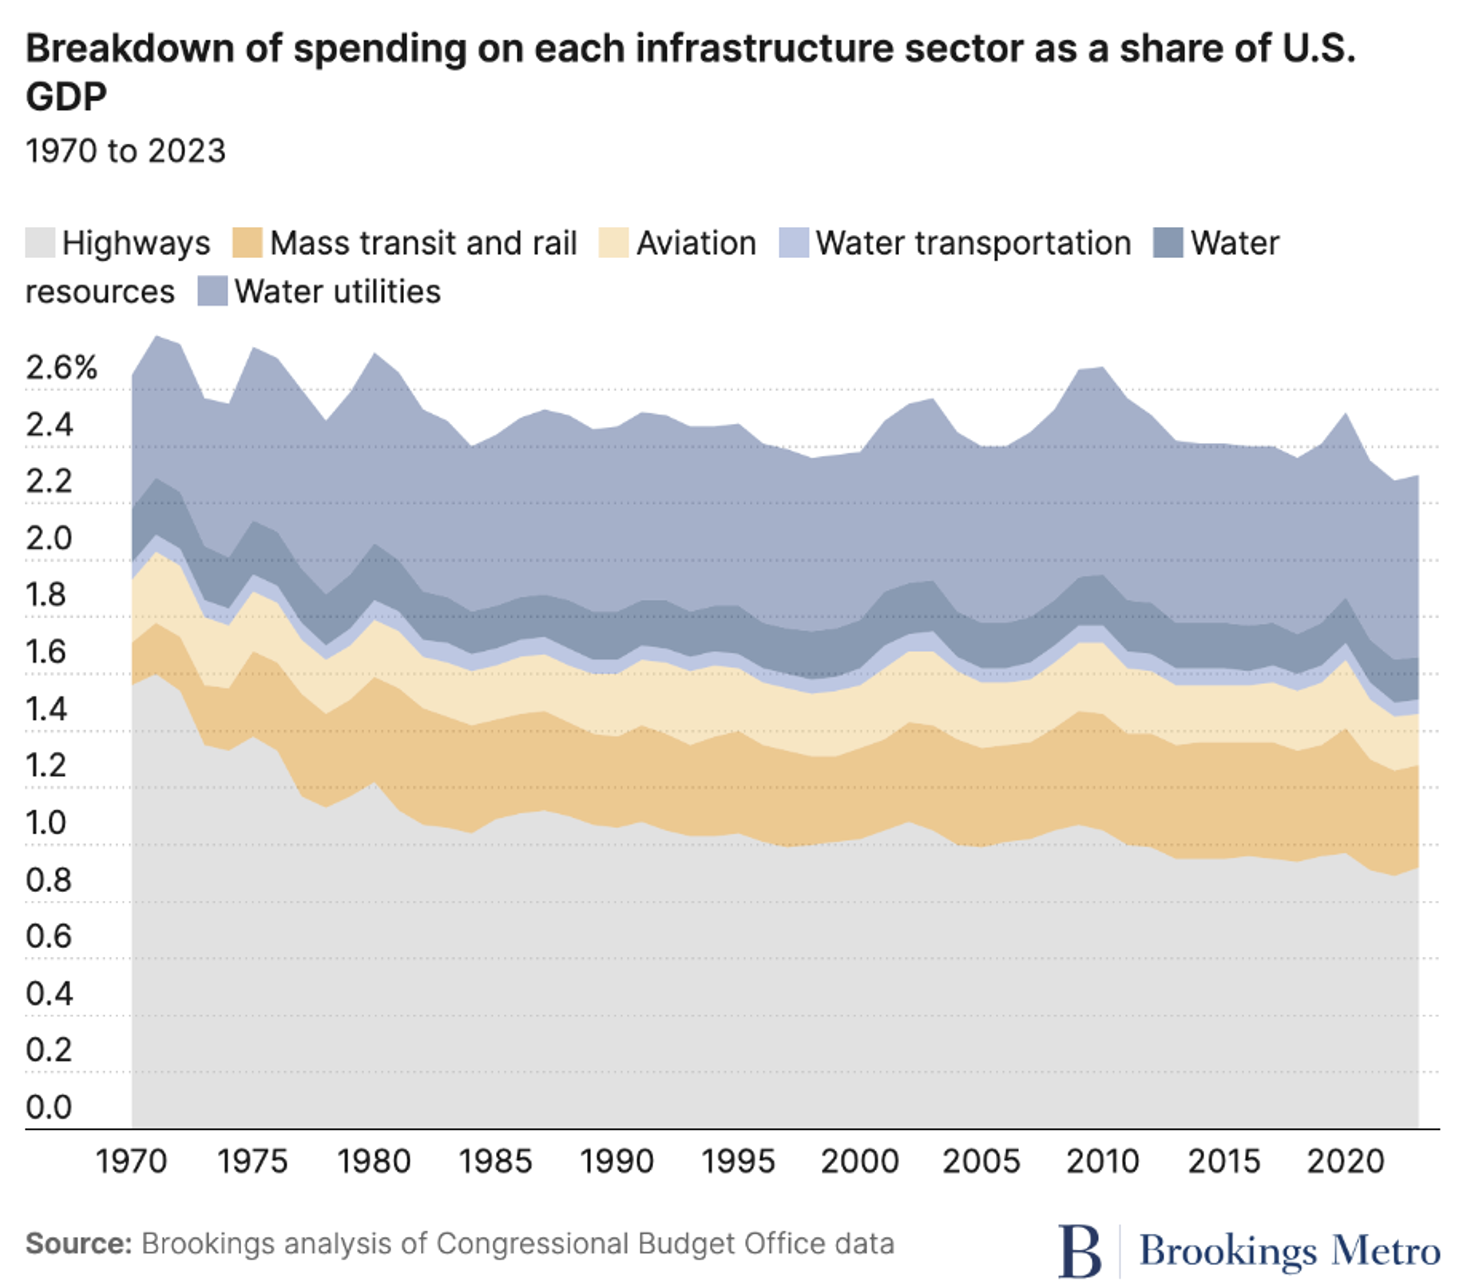
Infrastructure investment as a share of GDP has declined in 11 of the G20 economies since the global financial crisis. Several European countries spend as much as 5% of GDP on infrastructure, and the result is superior systems in several categories. As shown on the Brookings graph above, only recently has the US surpassed 2.5% of GDP in real infrastructure spending.
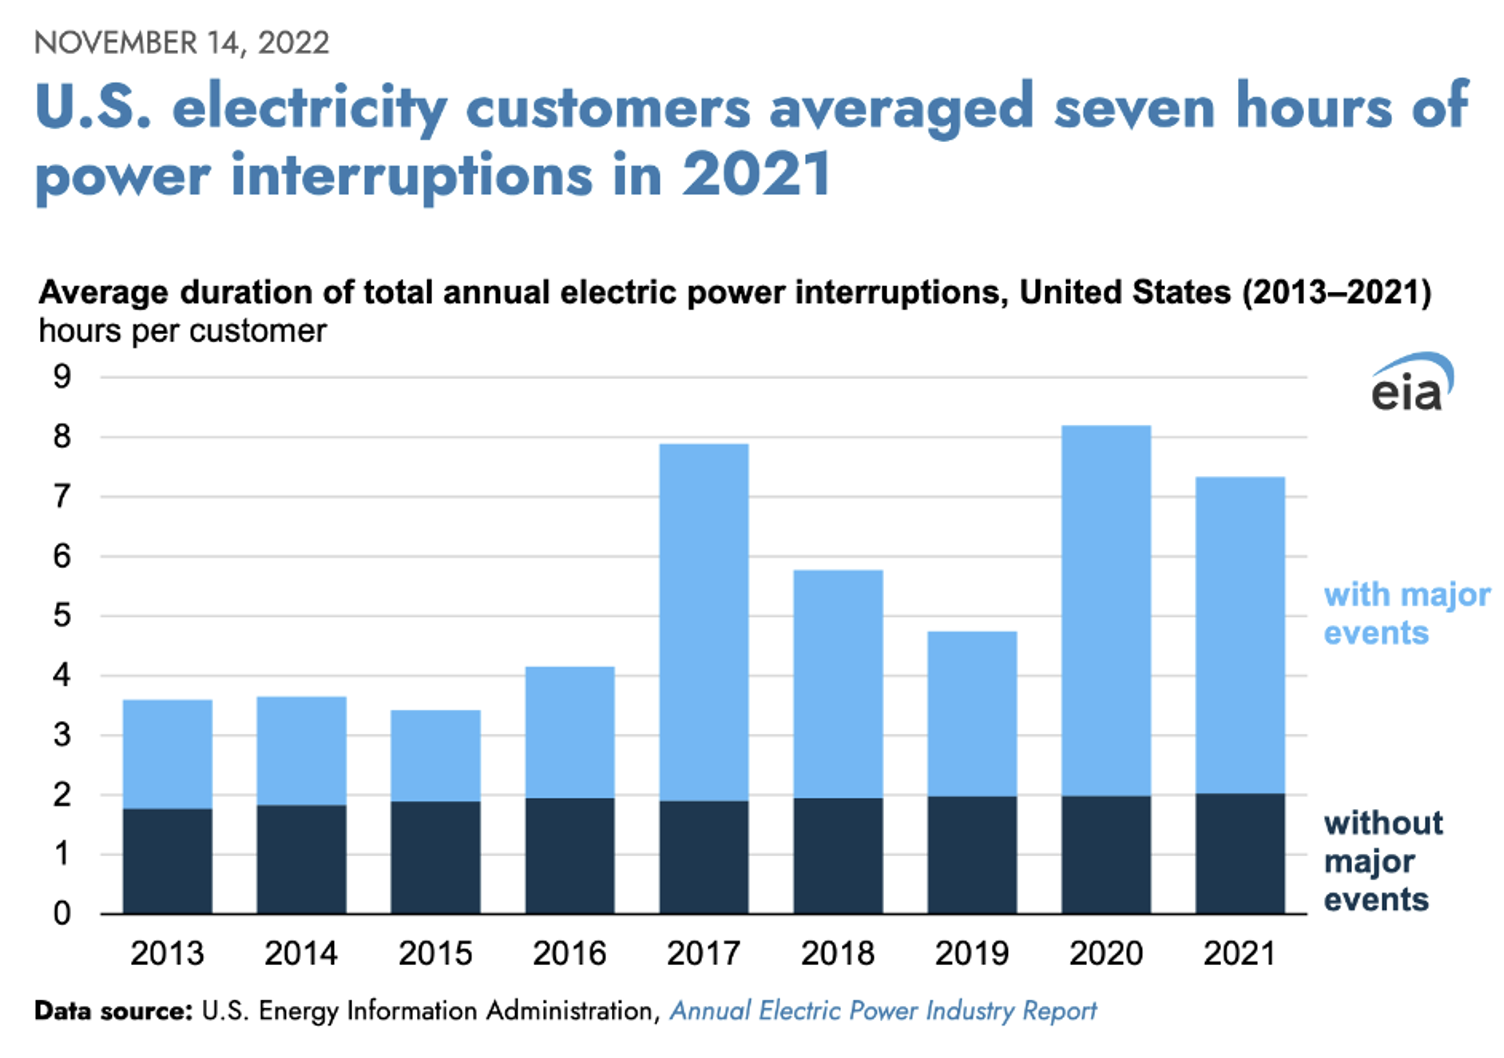
Energy and Power: The key metric used internationally to measure power outages is System Average Interruption Duration Index (SAIDI), or average annual outage time per customer. In 2020, the US averaged 8 hours per year, while top performers like Switzerland, Germany, France, and the UK came in at less than half an hour per year. Outage time jumps much higher when including major weather events: EIA data indicates that US customers lost power for an average of 7.2 hours total in 2021.
In 2016, roughly half of US customers had advanced metering infrastructure (AMI), but deployments later slowed as utilities approached market penetration limits. In the EU, member states were obligated to ensure 80% of consumers had intelligent electricity metering systems (the AMI equivalent) by 2024. In the UK, by 2019, the Smart Metering Implementation Programme had upgraded over 16.6 million electricity and gas meters from traditional analog, driven by the government’s aim to reduce carbon emissions to net zero by 2050. The program was estimated to result in £5.6 billion of savings for customers and reduce carbon emissions by 45 million tonnes.
Transportation: The ASCE gave US roads a D grade in 2021, reflecting the large percentage of roads in need of repair and the significant backlog of maintenance. ASCE estimated that 43% of public roadways in the US were in poor or mediocre condition and that the US needed to invest $786 billion by 2039 to bring its road infrastructure up to an acceptable standard. Current investment levels are insufficient to address these needs. The failure to keep up with road and highway upkeep is evident in the drop in highway investment as a percentage of GDP, as shown in this chart from Brookings:
European suburbs were designed around train and metro stations, while US suburbs were built along highways. Paris’s RER rail network (built to connect the city’s fragmented suburbs) moves more people annually than all US commuter railways combined. Canada, more geographically analogous to the US than Europe, has also successfully implemented internal transportation in cities. Of the North American metros analyzed by Brookings, only Canadian metros and New York increased ridership (in a range of 5-46%) between 2012 and 2017, while the other 13 metros showed a decrease.
High-speed rail (HSR) is an efficient transportation option that reduces congestion and oil consumption. Though a number of state and federal proposals have included HSR funding, the US currently does not have a single mile by some definitions (trains with speeds that start between 120-155 mph and can be sustained). America’s fastest train, Amtrak’s Acela Express, reaches a top speed of 150 mph in one section, but averages only 68 mph.Amtrak began rolling out its NextGen Acela trains, known as the Avelia Liberty, on August 28, 2025, replacing the older high-speed fleet. These trains can reach speeds of up to 160 mph, 10 mph faster than the current Acela. The improvements aim to boost both speed and passenger comfort, but the trains’ top performance will still be limited by the aging infrastructure of the Northeast Corridor, where track, bridge, tunnel, and signal upgrades are needed to unlock their full potential.
Globally, Japan’s Shinkansen HSR trains regularly run up to 200 mph, France has the TGV, Spain has the AVE, and China has more HSR than the rest of the world combined. In 2008, the Shanghai maglev train was reaching speeds of 267 mph.
Information and Communication Technology Adoption and Security: Korea, China, and Russia lead in IT adoption, and pose increasing cybersecurity threats to the US as they become more capable of accessing our energy control and information systems.
The International Telecommunication Union's Global Cybersecurity Index evaluates nations based on their commitment to cybersecurity, including legal, technical, and organizational measures, as well as international cooperation.
The US ranked 1st in the GCI 2020. The US scored highly in terms of its cybersecurity policies, legal frameworks, and incident response mechanisms.
Resilience: The resilience of a country’s infrastructure refers to its ability to respond to and recover from disruptive events such as natural hazards and cyberattacks. On the FM Global Resilience Index, which measures the resilience of countries based on 18 factors, the US falls behind a number of European and Asian countries. Cybersecurity is considered a key aspect of resilience; in their efforts to protect against cyberattacks, several developed countrieshave improved their position from the year before on the ranking of inherent cyber risk. The 2025 FM index ranks Denmark as the most resilient business environment globally, followed by Luxembourg, Norway, Switzerland, and Singapore. The United States is divided into three regions in the rankings, with the central US ranked at number 10.
How can a modern infrastructure be achieved?
The 1988 Fragile Foundations report called for government, private industry, and the public to make a national sustained commitment to “vastly improve America’s Infrastructure.” The same is needed now, beginning with increased investment.
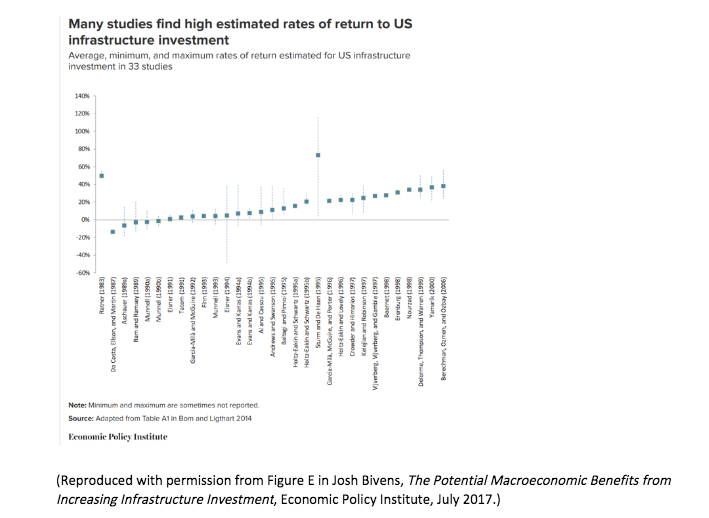
For every $1 invested in infrastructure, as much as $3 in economic activity is estimated to be created, a much more efficient fiscal stimulus than almost any form of tax cut. As reported by the Economic Policy Institute in “The Potential Macroeconomic Benefits from Increasing Infrastructure Investment,” studies frequently find that infrastructure investment yields high rates of return. Further, studies have found that public capital investment yields a higher rate of return than private (S&P Global, 2019).
Today, the UN’s three core strategies for mobilizing infrastructural change are making the most of existing infrastructure; recruiting the right talent and building the right skill sets; and investing in data, collaboration, and governance. Money from both private and public investments needs to be directed to projects that will yield stable, long-term returns.
These programs should focus on innovation of new technologies and investment in education to train a highly skilled workforce to manage the new systems. Major infrastructural revolutions historically require a much longer schedule for implementation, but the significance of the need should stimulate new strategies for accelerated change and development. This project would need to consider also that disruptive technologies will change infrastructure needs in ways we cannot yet quantify.” Disruption of the coal and fuel industries will substantially shake current economic systems, including patterns and volumes of bulk freight traffic.
What was President Biden’s approach to infrastructure?
President Biden's Infrastructure Investment and Jobs Act was signed into law on November 15, 2021, and represented a historic $1.2 trillion investment aimed at modernizing America's infrastructure. This comprehensive legislation allocated funds across various sectors, addressing critical needs in transportation, broadband, and climate resilience.
A significant portion, $110 billion, was dedicated to repairing and upgrading roads and bridges, with a particular focus on addressing the approximately 173,000 miles of highways and 45,000 bridges currently in poor condition. The bill emphasized climate change mitigation and safety for all users, including cyclists and pedestrians. In addition, it allocated $39 billion for public transit, marking the largest federal investment in this area, aimed at modernizing transit systems and enhancing accessibility for underserved communities.
For passenger and freight rail, the bill invested $66 billion to improve services and eliminate backlogs, particularly in Amtrak's operations, while also providing funding for electric vehicle (EV) infrastructure with $7.5 billion designated to develop a national network of EV chargers.
Moreover, the bill introduced a $1 billion program to reconnect communities divided by past transportation projects and ensured that funding was directed towards clean energy solutions, including the purchase of electric school buses. Overall, the legislation aimed to create jobs, boost economic growth, and make significant strides toward a more sustainable and resilient infrastructure.
Countries that set an example
As noted above, several countries spend considerably more than the US does on infrastructure, as measured by percentage of GDP. Also, as discussed elsewhere (see Defense Policy and Social Welfare Research), the US’s level of defense spending is not replicated by any other industrialized country. While dollars are fungible and no direct relationship can be proven, it is logical to assume that a reduction in military spending in the US would enable a material increase in infrastructure spending. It is also clear that spending in most industrialized countries is far more centralized than it is in the US.
China: China ranks first globally in infrastructure spending, according to World Population Review. China's infrastructure investment in 2021 amounted to 4.8% of its GDP, far exceeding the percentages seen in most other countries. In 2023, China invested more money into infrastructure than any other country, focusing on transportation networks, industrial parks, social housing, and municipal administration.
In 2023, China had more than 42,000 km of high-speed rail. This transport system has connected their vast country, as the US interstate system did in the 1950s, enabling cheap and efficient travel that increases productivity through employment opportunities, cheaper goods, and reduction of rural-urban inequalities. Rural populations have benefited from residential provision of electricity, running water, and telephone lines.
Chinese companies are also aiding other countries in development of their infrastructure. Projects across Africa and other countries such as Afghanistan provide China access to resources and diplomatic opportunities. From 1975 to 2018, China funded more than 6,200 km of railways and 5,000 km of roads in Africa, including the $4 billion Addis Ababa–Djibouti Railway that connects Africa’s fastest-growing economy, Ethiopia, to the Red Sea. Since 2013, China has been building global infrastructure through the Belt and Road Initiative, which the Center for Foreign Relations called “one of the most ambitious infrastructure projects ever conceived,” harkening back to the original Silk Road, which connected Europe to Asia centuries ago.
Chinese loans to Africa, totaling $182.28 billion between 2000 and 2023, have been primarily directed toward energy and transportation. 2023 saw a notable rebound in financing for renewable energy projects: China issued $4.61 billion in new loans to eight African countries and regional financial institutions, signaling a cautious resurgence in its funding post-pandemic.
France:. According to the most recent data from the World Population Review, France ranks fourth in Europe for high-speed rail, with approximately 2,735 kilometers of operational high-speed rail lines. It follows Spain, which leads with 3,661 kilometers, and is ahead of Germany and Italy.
France’s 2020 target of sourcing 23% of gross final energy consumption from renewables, including 10% from wind, was almost met, with the share reaching about 19%. Since then, progress has continued: in 2023, renewables accounted for roughly 22.2% of final energy use, and France’s CO2 emissions per capita were less than half that of the United States. A number of regional and federal initiatives, including the Bourgogne Développement program, have advanced its generation of renewable energy. Total renewable electricity generation capacity rose to 76.7 GW in 2024, with notable growth in solar—up to 24.3 GW—and steady expansion in onshore and offshore wind. Nuclear power remains the largest source of electricity in France, but its share has gradually declined as solar and wind have expanded. The government now aims for 40% of final energy consumption from renewables by 2030 and has set detailed capacity targets, including 54–60 GW of solar and 33–35 GW of onshore wind by that date. Offshore wind is a key focus, with capacity reaching 1.5 GW in 2024 from projects like Saint-Nazaire, Fécamp, and Saint-Brieuc, and a national goal of 45 GW by 2050. Earlier plans for a 500 MW wind farm off Dunkirk are part of this broader rollout, with new tenders expected in 2025. France’s grid operator estimates that renewable electricity output will need to triple by 2035 to meet climate targets.
In the cybersecurity domain, the National Cybersecurity Agency of France (ANSSI) remains a pioneer. Its 2013 rules for critical infrastructure protection were the first mandatory standards of their kind in Europe, and ongoing updates continue to guide resilience planning for energy and other vital sectors.
Germany: Germany ranked first in infrastructure by the CMS infrastructure index.
While public and private agencies are jointly responsible for US infrastructure, the integrity, reliability, and accountability of German critical infrastructure (including transportation, health, water utilities, telecommunications providers, and finance and insurance firms) are the responsibility of the central government and its security agencies.
Munich has more than 500 km of rail, combining subway and S-Bahn commuter rail, which enables transport across the city in a half-hour. Denver, with a comparable population to Munich, only has 158 km of light and commuter rails and limited feeder transportation to stations. While Germany’s transit systems are run by a number of different agencies, a traffic union coordinates fares and schedules so they function as one system to users.
Germany is also a leader in renewable energy, particularly in solar and wind power. In 2023, the country added a record 14.1 GW of solar power capacity, significantly boosting its total to 81.7 GW. This increase was largely driven by residential solar installations, with about half of the new installations being on homes. However, onshore German wind turbines contribute the largest share of renewable energy. Because Germany has continuously modernized its grid system, the country is able to employ wind turbines with significantly greater capacity than the US. Germany has 60.9 GW of installed onshore wind capacity and 8.5 GW of offshore wind capacity. Together, renewables accounted for approximately 54% of Germany's electricity consumption in 2023, marking a notable rise from just 3.2% in 1991.
Our infrastructure spending has fallen despite the breadth of research illustrating the economic benefit of infrastructure investment, and a number of attempts by politicians to implement programs that do so. President Trump has repeatedly advocated for investment in US infrastructure and had pursued a bipartisan $2 trillion infrastructure plan with leading Democrats before negotiations halted due to other political tensions. The lack of progress in Congress, according to Brian Pallasch from the ASCE, is in part because of our “broken” budget process. Pallasch and a coalition of government affairs professionals outlined five steps to creating a better budget process.
Multiple sources for these funds have been proposed. The Highway Trust Fund (HTF) gas tax, which funded the interstate system, has been fixed without adjustment for inflation since 1993, resulting in a 40% decline in purchasing power as illustrated by the graph below.
Claire Kelly is a part time researcher for OurFutureAmerica®. She studied Neuroscience and Anthropology at Union College, before completing a post-graduate fellowship in India where she worked with a rural development social enterprise. She is interested in how people and policy can drive both domestic and international rural development.