
Climate Change Research
Explanation of source links:
Throughout the research below, you will find links of three types. The first and most frequent type is to primary sources such as governmental agencies. The second is to nonprofit groups that generally use government data or their own research to support their philanthropic mission. We have tried to use the least biased of these, or when in doubt, we have identified their bias. The third is to articles in periodicals or newspapers that we find to be of interest. These are not meant to be construed as original sources, and in some cases may not be accessible, depending on a reader's frequency of prior visits to the linked periodical or newspaper.
What is the definition of climate change?
Climate change refers to a change in regional and global climate patterns associated with an increase in global average temperatures. Such increases in temperature are a result of increased levels of atmospheric greenhouse gases (GHGs) that trap heat in the atmosphere. The increase in GHGs is the result of human activity beginning with the period of industrialization. The consequences of these changing climate patterns include the melting of the polar ice caps, protracted drought conditions, rising sea levels, and more frequent instances of extreme weather.
How have global average temperatures increased?
As shown in the following chart, scientists have estimated that global average temperatures have increased by one degree Celsius since 1850, the beginning of industrialization.
Source:Climate.gov
What are GHGs?
GHGs include carbon dioxide (CO2), methane (CH4), nitrous oxide (N2O), fluorinated gases, and water vapor.
How do GHGs warm the atmosphere?
The sun emits light in the form of shortwave radiation that passes through our atmosphere. Some of this light is absorbed and some is re-emitted by the Earth’s cooler surface as infrared radiation. The GHGs present in the atmosphere capture and absorb a portion of this radiation, thereby warming the atmosphere.
The capacity of GHGs to trap heat in the atmosphere is referred to as the greenhouse effect. The greenhouse effect was discovered in the 1800s when scientists calculated that the Earth was 59 degrees (F) warmer than could be accounted for by the sun’s rays alone.
Which GHGs contribute the most to warming?
Water vapor is the most abundant GHG and accounts for approximately half of the warming effect. The second is CO2, followed by methane. For the reasons explained below, however, CO2 is the most important.
Doesn’t water vapor occur naturally?
Yes, water vapor occurs naturally in the atmosphere. However, as the Earth’s temperature rises, it increases the amount of atmospheric humidity (the amount of water the atmosphere can hold), thereby increasing the amount of heat retained by the atmosphere. This cycle is referred to as “water vapor feedback.” While water vapor is technically the largest contributor to average temperatures, it is the initial heat retention caused by other GHGs that increases water vapor’s warming effect. Water vapor also condenses and falls as precipitation when it reaches maximum density. Other GHGs, like CO2, can remain in the atmosphere for thousands of years.
So, CO2 is the most important GHG?
Yes, for three reasons. First, it contributes directly to heat retention in the atmosphere. Second, it contributes to the water vapor feedback loop, and third, it remains in the atmosphere the longest. Methane, the third largest contributor, is more efficient at trapping radiation than CO2, but only has an atmospheric lifetime of 12 years.
But isn’t CO2 also naturally occurring?
Yes. CO2 is one of the three gaseous components of air, and is made up of oxygen and carbon. Carbon is a chemical element of the periodic table and is widely distributed naturally. It can be found in rocks such as limestone, fossil fuels such as coal and oil, living organisms, oceans, and the atmosphere. Carbon naturally moves through the food chain. Plants convert atmospheric carbon into sugar molecules through photosynthesis, and those plants are digested by animals for energy. Respiration, excretion, and decomposition release this carbon back into the soil or atmosphere as CO2 to complete the cycle. In the atmosphere, CO2 levels are measured in parts per million (ppm).
If CO2 is natural, how does nature regulate it?
If undisturbed by human activity, nature manages a massive and complicated carbon cycle that results in equilibrium of CO2 levels. Some natural functions of the planet and its vegetation emit CO2 into the atmosphere, while others absorb it.
Carbon storage is referred to as a “stock” or “pool.” The largest stocks are the continental crusts and upper mantle of the Earth. Earth’s vegetation and oceans (the second and third largest stocks respectively) are responsible for storing and pulling large amounts of CO2 out of our atmosphere. All vegetation does not have the same carbon appetite or storage practice.
Warm, tropical regions tend to store carbon above-ground and have some of the fastest turnover of that carbon, while cool, boreal forests have large stores of belowground carbon and hold that carbon, on average, more than three times longer than tropical forests.
How are atmospheric CO2 levels measured?
CO2 levels in the atmosphere are measured on regular intervals by a number of organizations, including the National Oceanic and Atmospheric Administration’s (NOAA) Earth Systems Research Laboratory. The laboratory measures the molecules within air samples and expresses the results in ppm.
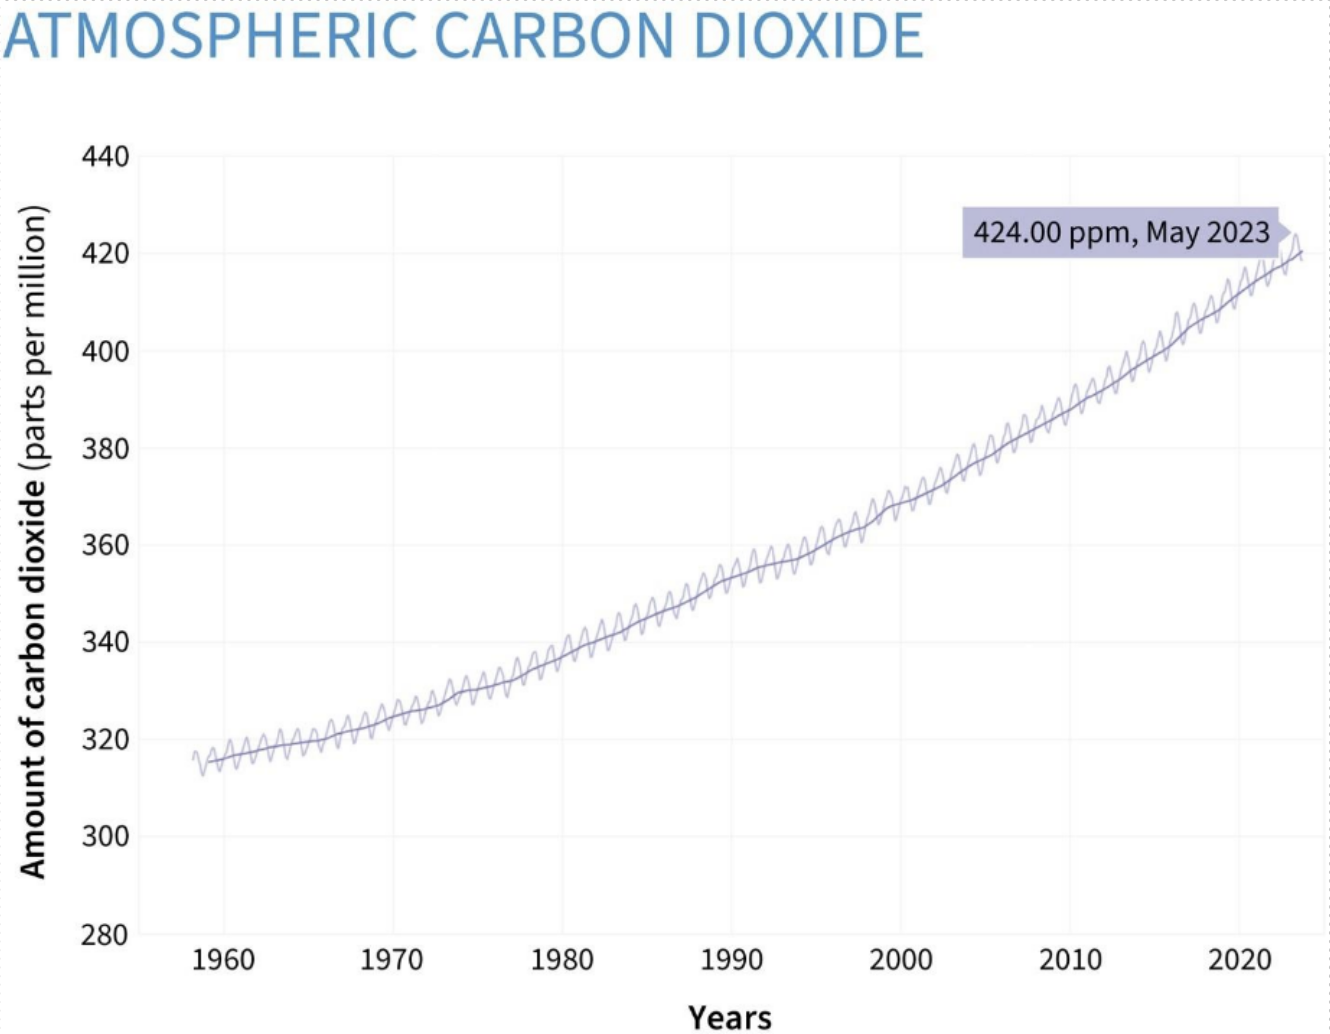
How have atmospheric CO2 levels changed over time?
Measurements from the NOAA over a 60-year period illustrate a definitive and steady increase in CO2 concentrations, as shown in the graph below, from the first recording of 316 ppm in 1958 to 424 ppm as of 2024. Annual atmospheric CO2 levels vary naturally by around 5 ppm between seasons, but are increasing by around 2.8 ppm annually. The largest year-over-year increase in atmospheric CO2 concentration on record occurred in March 2024, when the monthly average was 4.7 ppm higher than the same month in 2023. This is a relatively recent trend. Data over the past two millennia show a substantial increase in not only CO2 but also CH4 and N2O.
Source: Climate.gov
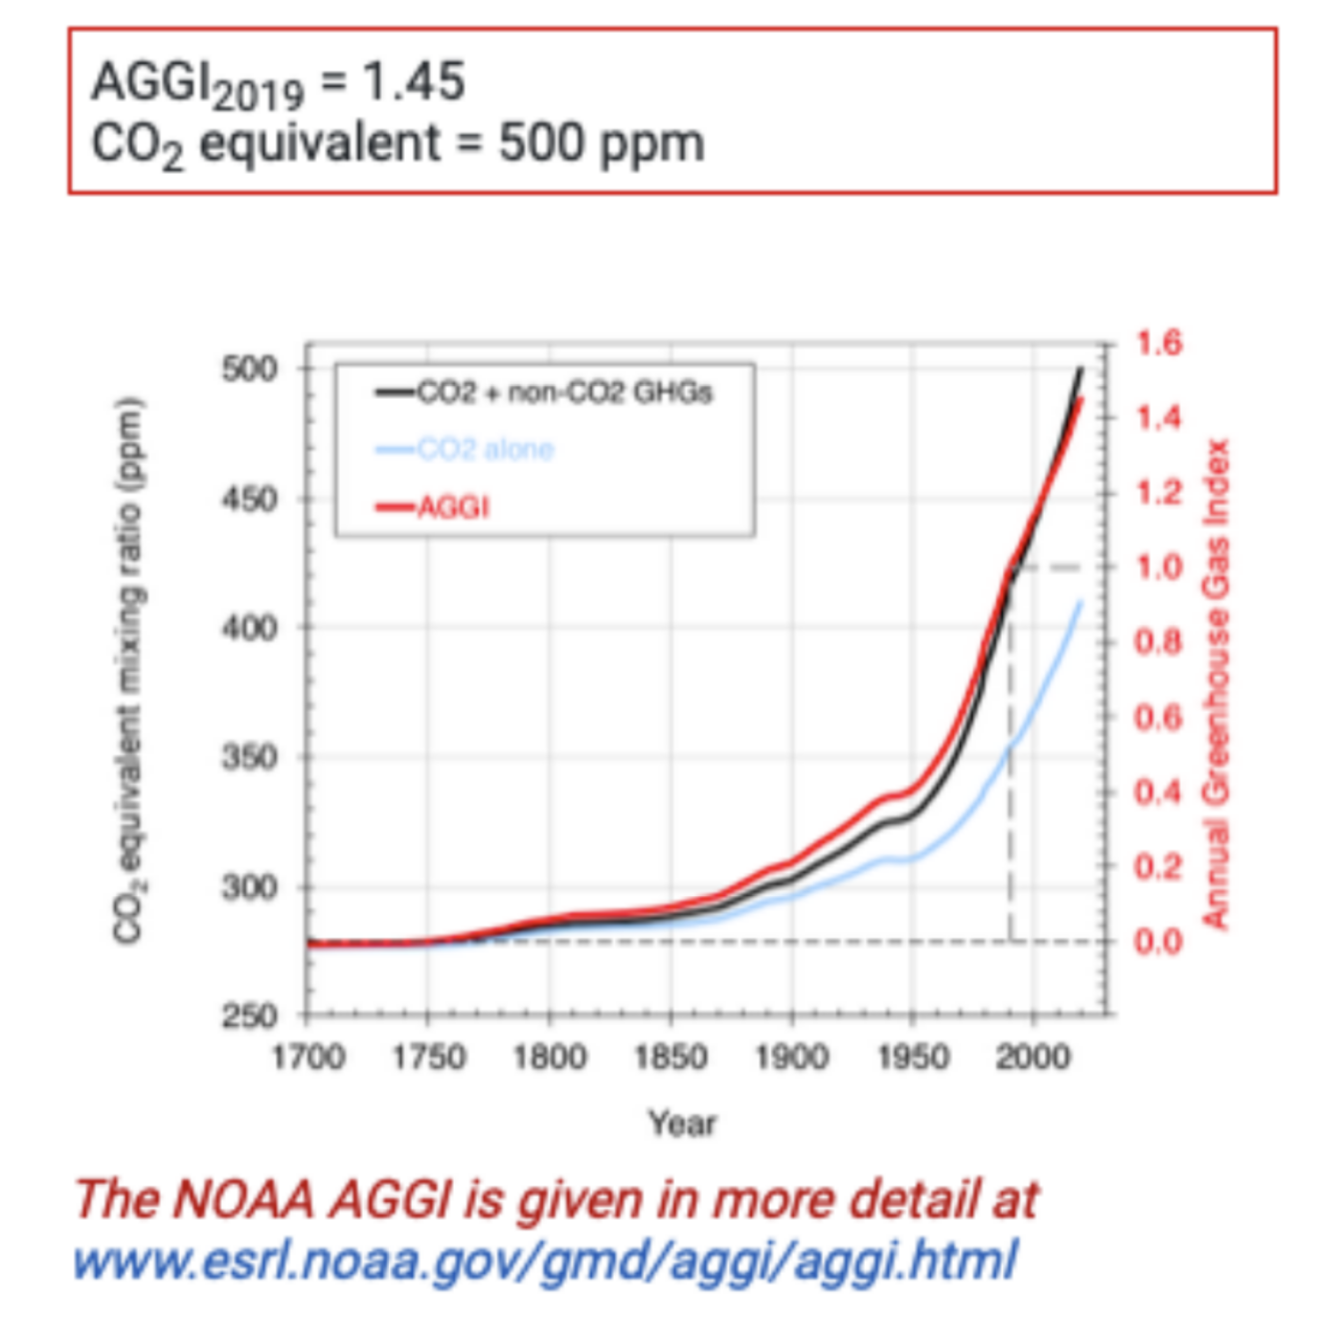
Source: Sixth Annual Intergovernmental Panel on Climate Change (IPCC) report.
AGGI= Annual Greenhouse Gas Index
How do human emissions affect the Earth’s normal carbon cycle?
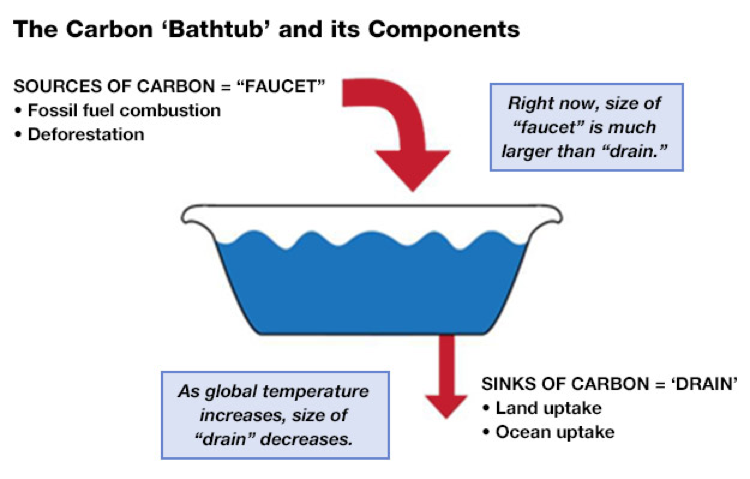
The human contribution of carbon emissions overwhelms the natural capacity of the Earth’s oceans and vegetation to reabsorb carbon. The result is a net increase in atmospheric carbon. The most common illustration of this is the bathtub analogy.
In this analogy, the “bathtub” is the Earth’s atmosphere and the “faucet” represents both manmade and natural processes that release “water” (carbon) into the tub. The “drain” represents the natural processes that can lower the water (carbon) level. With only natural processes controlling the faucet, the water level can fluctuate at manageable levels within the tub, but with the addition of manmade processes, the tub can fill, and even overflow. Further, human activity such as deforestation can “clog” the drain, slowing down the removal of water.
How has human activity affected the natural CO2 levels?
The harnessing of energy through combustion of coal and oil was central to industrialization and the development of modern transportation systems, but this process emits CO2 and water vapor into the atmosphere. Under natural circumstances, this carbon may have remained in the ground for millions of years. Anthropogenic (originating in human activity) emissions and land use have shifted 19-36% of carbon out of these stores into the atmosphere and ocean. More than half of historic fossil fuel carbon emissions have occurred in the last three decades.
How much are CO2 levels expected to rise by 2100, and how much would the planet warm as a result?
Predicting future CO2 levels is difficult because the levels will be affected by human behavior over the period measured. Therefore, scientists create models based on different assumptions of fossil fuel use. The International Energy Agency (IEA) estimates that if nothing is done to reduce emissions, the world is on track to increase total CO2 levels by as much as two times the current level over the balance of the century. Models assuming varying efforts to reduce emissions predict lower levels. Models assuming efforts on the lower end project that concentration will reach 700-750 ppm by the year 2100.
“Climate sensitivity,” or the amount that temperature will increase as CO2 concentrations increase, is also difficult to determine, but various models have estimated 1.5-4.5 degrees Celsius of warming. In a high-emissions scenario, global temperatures could rise by as much as 5.7 degrees Celsius by 2100. Models that look at warming through the end of the century estimate that the likely upper bound is five degrees, although the worst case would be a warming of eight degrees.
What natural feedback loops are triggered by climate change?
NASA climate scientists have identified three categories of factors affecting climate change: forcing, feedback, and tipping points. Forcing initially drives climate changes and includes solar irradiance and GHG emissions. The second category is climate feedback, defined as processes that either amplify (positive feedback) or diminish (negative feedback) the effects of climate forcing. While forcing may lead to some amount of warming by itself, it is the feedback that accelerate the warming process.
Oceans and ice: A surface’s ability to reflect solar energy is known as “albedo” and varies between 0 (absorbs all energy) and 1 (reflects all energy). Sea ice with snow can have an albedo of up to 0.9, reflecting up to 90% of incoming solar radiation and insulating the ice. The loss of ice, which has an albedo of 0.5 to 0.7, is a positive feedback process. The darker ocean, with an albedo of only 0.06, absorbs much more solar energy, causing more melting of ice and continued warming. This is considered very strong positive feedback.
Water vapor: Water vapor is one of the strongest climate feedback factors. As the planet warms, the atmosphere holds more water vapor. Increased water vapor in the atmosphere can more than double the direct warming from CO2 in a positive feedback loop. Clouds from increased water vapor can reflect solar energy for negative feedback, or trap heat in the atmosphere for positive feedback, depending on the location and type of clouds.
Methane: Methane is another GHG that causes positive feedback. It is stored in frozen peat bogs, permafrost, and other stocks under the sea floor; increasing temperatures thaw these stores and release the trapped methane into the air, amplifying warming.
The feedback processes add momentum to even small amounts of warming, making climate change challenging to predict. Even more challenging to predict or measure is the potential for these natural systems to become “tipping points,” which can move the Earth’s climate between drastically different stable states. Both ice loss (in the Arctic, Greenland, and west Antarctic) and mass release of methane could become tipping points.
How do rising temperatures affect our weather systems?
The effects of “global warming” are not, as the name may misleadingly imply, limited to warmer temperatures. In fact, higher global temperatures make the atmosphere more energetic, contributing to more intense weather fluctuations and less predictable weather events. This increased intensity and decreased predictability can be found across our entire climate system, from wind, clouds, and storms to heat waves and more.
As an example, warming air boosts evaporation and increases water vapor in the atmosphere. This can worsen the length and severity of droughts while at the same time leading to heavier, more dangerous rain and snowstorms.
Weather events are classified as extreme if they are unlike 90-95% of similar weather events in the same area. Scientists are learning to estimate how increased GHGs can make an event more severe or more likely to happen, a process called “extreme event attribution.”
What are some observable effects of climate change?
Extreme global temperatures
The planet’s average surface temperature has risen about two degrees Fahrenheit since the late 19th century. Since 2001, 22 of the 23 warmest years on record have occurred. This includes every year from 2010 onwards, which have all ranked among the hottest years globally. 2024 was the warmest year on record. Six of the 12 months were the warmest ever recorded for their respective months. These months were January, February, March, April, June, and September.
In 1950, record lows and record high temperatures over the course of the year were equal. In 2015-2025, record high temperatures happened twice as often as record low temperatures.
Many of the deadliest heat waves in recorded history have happened since 2000. Heat fatalities in the period 2000-2010 were up more than 2,000% compared to the previous decade, according to the World Meteorological Organization. Heat waves are one of the deadliest kinds of natural disaster in the US and kill more people in cities annually than hurricanes, lightning, tornadoes, and floods combined.
In North Africa and the Middle East—home to over a half billion people—the average annual number of extreme high temperature days has doubled since the 1970s. If emissions continue at current levels, by mid-century, this number could increase from 16 extremely hot days per year to around 80.
Hundreds of millions of people earn their livelihoods working outside, and billions more depend on goods and services that result from that labor. In high temperatures the human body expels heat by dilating blood vessels and increasing blood flow to the skin to release heat, while sweating cools the skin. At temperatures higher than the body, blood at the skin will not release heat, and in high humidity, sweat cannot evaporate and the skin will not cool. As a result, heat exhaustion and heatstroke can occur, triggering seizures and convulsions, and can be fatal without treatment. Even in less-than-fatal temperatures, working hours and productivity can drop.
Oceans and sea level rise
The top 700 meters (2,300 feet) of the global ocean has warmed about 1.5 degrees F since 1901. The rate of warming in the top 6,500 feet of ocean since the 1960s was recently discovered to be 40% higher than previously estimated. Scientists’ current calculation for the rate of warming stands at 0.42 watts per square meter (W/m²), revised from the former estimate of 0.3 W/m².
Glacial melt as a result of this warming has raised global sea levels by about eight inches in the last century. The rate in the last two decades, however, is nearly double that of the last century.
The Greenland and Antarctic ice sheets have decreased in mass: Data from NASA's Gravity Recovery and Climate Experiment indicate that Greenland lost 150 to 250 cubic kilometers (36 to 60 cubic miles) of ice per year between 2002 and 2006, while Antarctica lost about 152 cubic kilometers (36 cubic miles) of ice between 2002 and 2005.
Increasing uptake of carbon dioxide by the oceans (2 billion tons per year) has increased the acidity of surface ocean waters by about 30% since the Industrial Revolution, reducing carbonate in the water that marine organisms such as coral and plankton use to build their shells and skeletons. Additionally, acidic water dissolves their shells and damages corals, which provide habitat for millions of species.
The Great Barrier Reef, the world’s largest single structure made by living organisms and a World Heritage Site, is bleaching at an alarming rate. As of 2024, 40% of the corals had died. The Great Barrier Reef Marine Park Authority, which compiles a report on the reef every five years, most recently described the window of opportunity to save the reef as “closing rapidly” and stated that the damage was “largely driven by climate change.” The recent bleaching event in early 2024 was one of the most severe recorded, affecting over 90% of corals in some areas. Despite recent improvements in coral cover in certain regions, the overall outlook for the reef remains concerning due to the increasing frequency and intensity of climate-driven threats.
A 2019 NOAA study identified 40 different US locations facing accelerating high tide flooding trends. A major 2019 report from the Center for Climate Integrity/Resilient Analytics found that just seawalls in Florida could cost around $76 billion by 2040, with an estimated run-up to $400 billion nationwide.
After Hurricane Katrina, the Army Corps of Engineers invested $14 billion to construct levees and floodwalls in New Orleans. Recent research has shown that the walls are sinking at a rate of one to two inches per year, about ten times faster than sea levels are rising. The walls (notwithstanding sinkage) are designed to protect New Orleans from a 100-year storm: in other words, a storm that has a 1% chance of occurring in any given year.
A 2024 report estimated that property valued at $164 billion in the New York Metropolitan Region would be subjected to tidal inundation by the year 2100.
The Rhode Island Coastal Resource Management Council estimated that sea level rise would flood 605 buildings six times a year by 2030; efforts to build sea walls or move structures are only temporary solutions.
Rhode Island has also experienced a significant decline in its lobster catch, a problem attributable to rising sea temperatures. The catch fell from nearly seven million pounds in 2000 to just over one million pounds in 2023.
Mumbai, India—the financial capital of the country, with a population of more than 20 million people—has by some estimations the largest concentration of people at risk from sea level rise. The rise, paired with increasingly extreme weather events, threatens the entire city.
Increased frequency/intensity of extreme weather events
The intensity, frequency, and duration of North Atlantic hurricanes, as well as the frequency of the strongest (Category 4 and 5), have all increased since the early 1980s.
NOAA has concluded that on a global scale, there will be an increase in tropical cyclone precipitation rates, cyclone intensity, and frequency of “very intense” tropical cyclones.
While average annual precipitation has not changed, India’s Meteorological Department has confirmed that the seasonal reliability of the annual monsoons has increasingly changed to periods of drought followed by intense precipitation and floods. As a result, while Mumbai flooded for weeks at a time in 2019, reservoirs supplying drinking water to the southern city of Chennai dried out.
In 2018, the southern coastal state of Kerala, one of the most densely populated in India, experienced the worst floods in almost 100 years, affecting an estimated 5.4 million people. Between June 1 and August 28, cumulative rainfall was more than 42% higher than typical averages.
Wildfires in California have increased fivefold since 1972 as a result of hot, dry, and windy conditions. Increasingly fluctuating temperatures reduce the lifespan of asphalt, add stress to expansion joints on bridges, and cause bucking of railways, among other effects.
The southwestern US has experienced its driest 22-year period in over 1,200 years, straining water supplies and ecosystems. Research links the drought's severity to human-driven warming reducing soil moisture and snowpack.
Recent record-breaking extreme weather events
In January 2025, the California Palisades Wildfire destroyed over 6,800 structures in Pacific Palisades and Malibu, fueled by extreme drought and Santa Ana winds—conditions made more likely by climate change.
In September of 2024, for the first time ever, Asheville, North Carolina experienced a hurricane. Hurricane Helene dropped nearly 10 inches of rain, flooding Asheville. Scientists found warming made the storm’s rainfall over 50% heavier.
In June of 2024, Boston hit 38.9 degrees C, its hottest June day in a century, as part of a regional heatwave linked to climate-driven temperature extremes.
The2022 Pakistan floods were the largest in the country’s history. Catastrophic monsoon flooding killed over 1,700 people and displaced millions, submerging one-third of the country. Climate change made the intense rainfall up to 75% more likely.
Canada's worst wildfire season on record, 2023, burned over 18 million hectares, with smoke affecting air quality across North America. Attribution studies found that climate change more than doubled the likelihood of extreme fire-weather conditions.
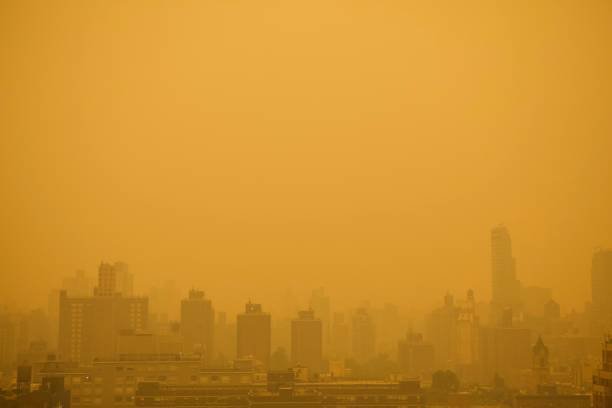
Also in June of 2023, due to the wildfires in Canada, New York City experienced its worst air quality since the 1960s, with air quality index readings surpassing 400, classifying the air as "hazardous." The sky above New York took on an orange hue due to the scattering of sunlight by the smoke particles in the atmosphere, highlighting the singular nature of the extreme weather event:
Economic Impact
Companies have started relocating operations away from flood-prone or wildfire-prone zones, such as in parts of the Gulf Coast and California. Real estate investors and logistics firms are increasingly favoring inland, climate-resilient cities (e.g., Columbus, OH, or Madison, WI).
Hurricane Ian, which struck Florida in September 2022, caused over $113 billion in damages, making it one of the costliest hurricanes in US history. As a result, several insurance companies went bankrupt or exited the Florida market, and some businesses began reconsidering operations in coastal, hurricane-vulnerable areas.
Across the US, insurance premiums are rising in areas vulnerable to changing climate, and certain areas are uninsurable. In California, where wildfires are increasingly frequent and damaging, the state banned insurance companies from dropping policies of customers in or near recent fire-affected areas. California insurers filed for 111 rate increases in 2023.
As of 2023, global fish demand is expected to increase by 14% while “fish populations in the oceans are being depleted due to destructive fishing practices, inadequate policies and climate change.” Fish is the primary source of protein or income for more than three billion people globally.
The Australian Great Barrier Reef, one of the most biologically diverse places in the world, which has suffered severe bleaching (as described above), supports 64,000 jobs and contributes $6.4 billion annually to Australia’s economy.
What is the current goal for stemming climate change?
The 2015 Paris Agreement set the goal of limiting global temperature increase to below two degrees Celsius, while pursuing efforts to limit the increase to 1.5 degrees. As of now, 195 out of 198 parties to the United Nations Framework Convention on Climate Change are parties to the Paris Agreement. Iran, Libya, and Yemen are the only countries that have not ratified the agreement. On January 20, 2025, President Trump signed an executive order initiating the yearlong process of withdrawal from the agreement. On January 20, 2026, the US will have officially withdrawn, but is as of this writing it is a party to the agreement.
Specifically, the agreement does the following:
1) Temperature Goal: Countries agreed to limit global warming to well below 2°C, and to pursue efforts to limit it to 1.5°C above pre-industrial levels.
2) Nationally Determined Contributions (NDCs): Each country sets its own emissions reduction targets, which are not legally binding, but must be reported and updated every five years.
3) Transparency and Accountability: A common transparency framework was established requiring countries to monitor, report, and verify emissions and progress toward their NDCs using standardized guidelines.
4) Global Stock-take: Every five years, beginning in 2023, countries will participate in a global assessment of collective progress toward the long-term goals.
5) Climate Finance: Developed countries committed to mobilizing at least $100 billion annually by 2020 (extended through 2025) to help developing nations with mitigation and adaptation efforts.
6) Adaptation Support: The agreement emphasizes building resilience and helping vulnerable nations adapt to the impacts of climate change.
7) Loss and Damage: The agreement recognizes the need to address loss and damage associated with climate-related disasters, though it stops short of requiring financial compensation.
8) Long-term Emissions Goal: Countries aim to reach global peaking of greenhouse gas emissions as soon as possible and achieve net-zero emissions in the second half of the century.
Why 1.5 degrees?
The Brookings Institute provides a brief history of this goal. “The origins are in the original international treaty on climate change, the 1992 Framework Convention on Climate Change. This treaty (which was negotiated under the George H.W. Bush administration), recognized the importance of climate change and set up a process for the international community to begin to address it. The core principle of the international approach to climate, formally embedded in that agreement, was ‘to avoid dangerous anthropogenic interference in the climate system.’”
“Consensus was built around the two-degree goal but there were concerns that even two degrees was too high. This led to the embedding of a 1.5 degree goal at the beginning of the landmark 2015 Paris Agreement: ‘Holding the increase in the global average temperature to well below two degrees above pre-industrial levels and pursuing efforts to limit the temperature increase to 1.5 degrees above pre-industrial levels.’”
The IPCC provides the following estimates of the impact and risk associated with the various degrees levels of warming below and above 1.5 degrees.
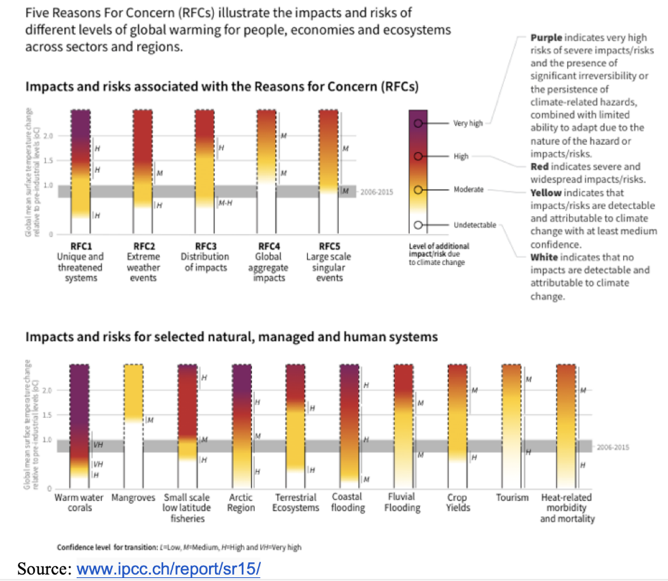
What are predicted outcomes at other levels of climate change?
Here is a breakdown of some of the predicted outcomes if we reach certain levels of warming by the year 2100:
Two Degrees
This is a tipping point that we are almost certain to reach, and by many estimates can be considered a “best-case scenario.” Predicted outcomes include:
Up to 99% of coral reefs would be wiped out.
Collapse of the planet’s ice sheets.
Flooding of hundreds of the world’s largest coastal cities, including Miami, Dhaka, Shanghai, and Hong Kong.
Major cities on the equatorial band would be unlivable due to heat.
Heat waves in the northern latitudes could kill thousands.
In India, heat waves would increase by 32 times in frequency and last nine times as long, resulting in exposure of 93 times more people.
Intensifying drought. Worldwide, 800 million to 3 billion people would experience chronic water scarcity at 2 degrees C.
Three Degrees
Southern Europe would be in permanent drought.
Average drought in Central America and the Caribbean would last 19 and 21 months longer, respectively.
Average drought in northern Africa would last five years or longer.
Areas burned by wildfires would double in the Mediterranean, and sextuple or more in the United States.
Four Degrees (“Hothouse Earth”)
Eight million more cases of dengue fever would occur in Latin America annually.
Global food crises would arise annually.
The world would see 9% more heat-related deaths.
In India, temperature increases could contribute to more than 1.5 million deaths annually, surpassing infectious diseases. 16 of India’s 36 states and union territories would become hotter than today’s hottest state (Punjab) with an average annual summer temperature around 90 degrees F.
Globally, damages could pass $600 trillion—more than twice the wealth that exists in the world today.
Eight Plus Degrees
A third of the Earth would be unlivable due to direct heat.
At the equator and in the tropics, humans would not be able to survive outside.
Oceans would swell to 200 feet higher, flooding two-thirds of the world’s major cities.
No land would be capable of efficiently producing food we eat today.
Forests would be roiled by firestorms.
Tropical disease would sweep as far north as the Arctic.
Today’s “intolerable” drought and heat waves would be the norm for all human life.
Though the models cannot predict where we will fall on this scale, if we continue industrial growth on the scale of the past 30 years, at the end of the century vast swaths of the Earth will be unlivable by the standards we have today.
Who are the largest global emitters of GHG from fossil fuel combustion and industrial processes?
In 2017, the global average of per-capita CO2 emissions was 4.8 tons. With the exception of a brief dip due to Covid in 2022, this number has remained stable. As of 2022 the top populous countries for per-capita emissions were the United States at 14.95 tons, Australia at 14.99, and Canada at 14.25. “Populous” is relevant, because the largest per capita CO2 emitters are low-population countries that are major oil producers, with #1 being Qatar at 37.6 as of 2022, followed by Trinidad and Tobago at 22.4 as of 2022.
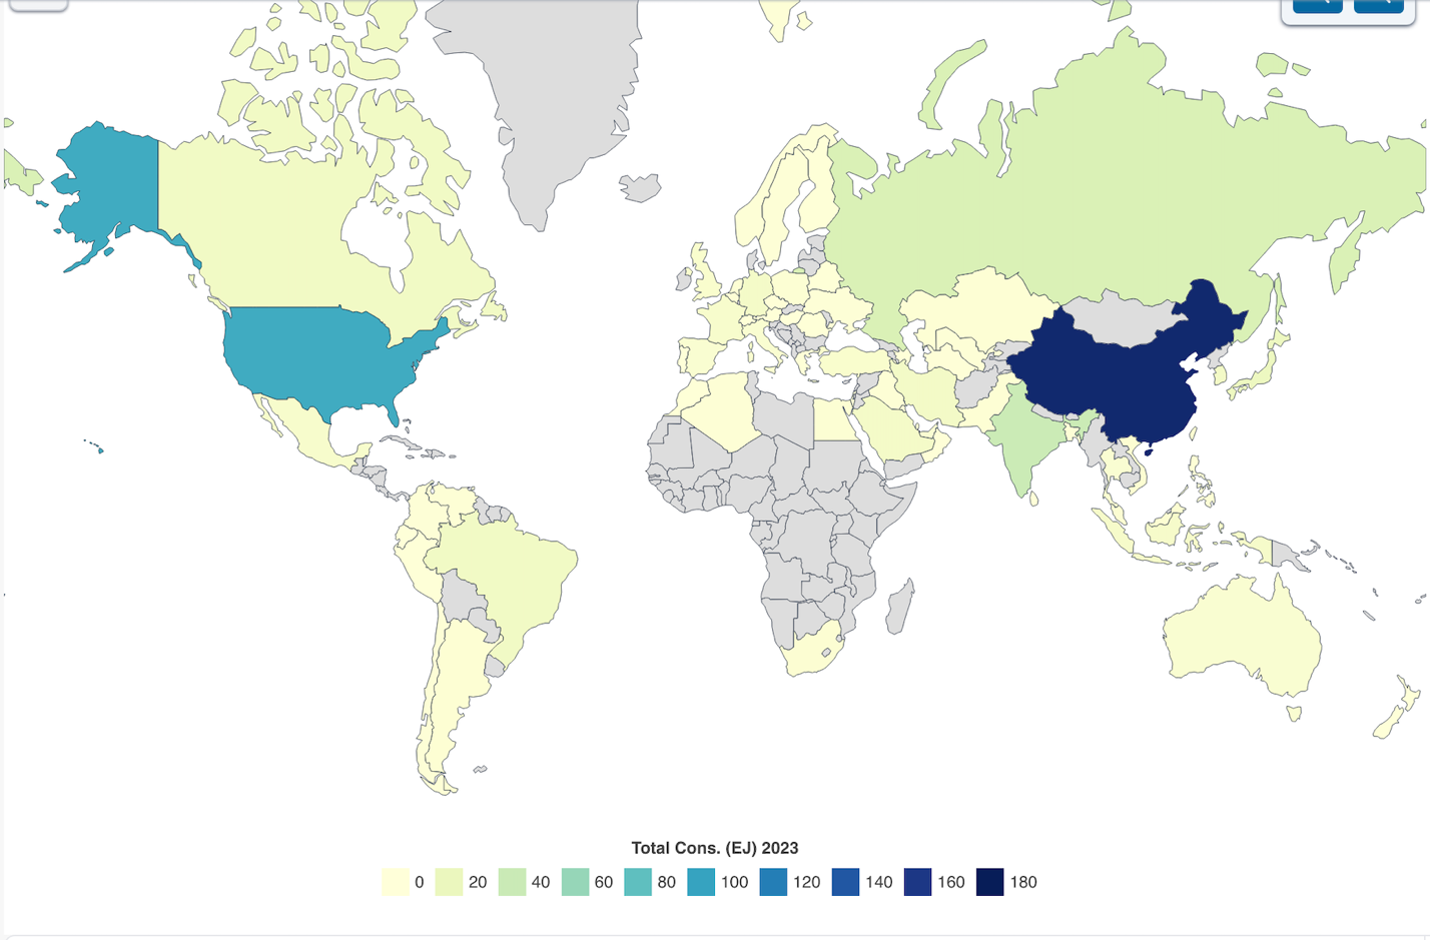
Looked at another way, in 2023, the measurement of primary energy consumption per capita for the US was 277 gigajoules. For Canada, it was 359.3 gigajoules, compared to 77.0 gigajoules per capita globally. This means we consume, per person, nearly four times the global average of primary energy, and Canadians consume over five times the global average (source). China, the top consumer of fuel by country, consumes only 119 gigajoules per capita.
Source: World Population Review
Why is US energy consumption so high?
Many factors contribute to our high emissions, but they all relate to our reliance on cheap energy.
Geography
The US has a low population density relative to other countries such as Japan or those in Europe. As a result, our homes can be larger (aided by subsidized mortgages), suburban communities are more spread out, and people live longer distances from workplaces. As you can read about in our Infrastructure Research, “mass transit is less developed, and we drive farther for commuting and recreation.”
Consumption
Americans have also enjoyed a history of cheap energy compared to the Europeans and Japanese. As a result, our homes are larger, our cars are bigger, we consume more water, and we have a habit of using disposable items, such as plastic bags, individual-serving-size packaging, paper products, cleaning products, and razors, more than our counterparts. All of these factors contribute to our being one of the largest emitters of carbon per capita among developed nations.
What does US energy consumption look like today?
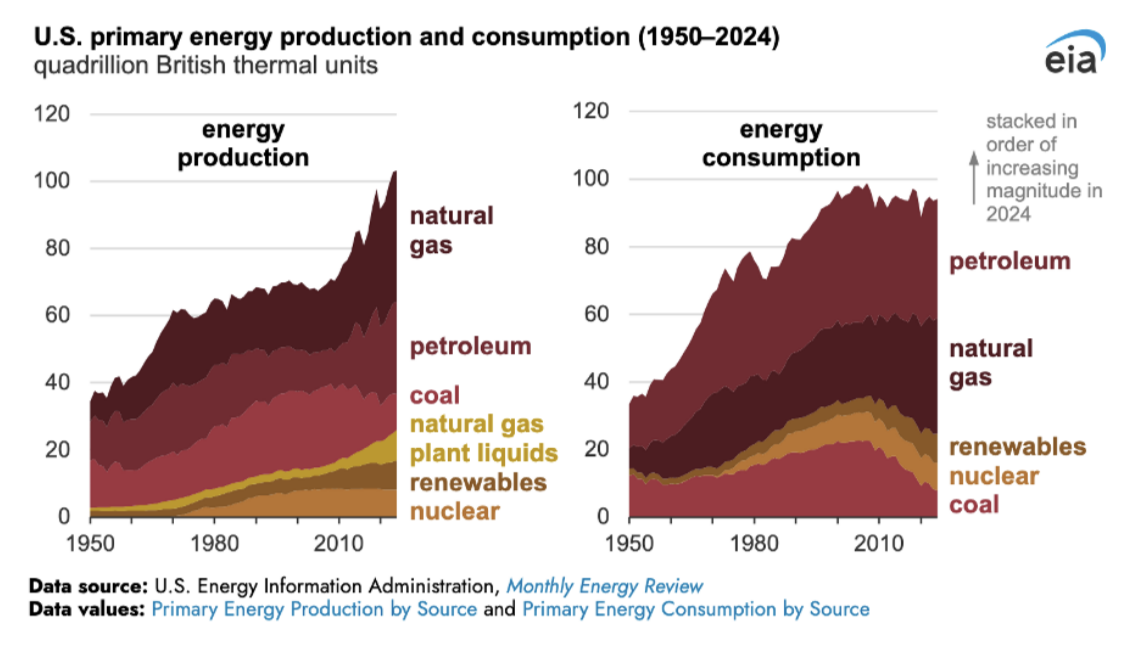
As can be seen in the chart above, our largest energy sources are petroleum (crude oil) and natural gas, followed by coal, which has declined over the past decade. Coal-generated electricity has been in systemic decline for several years because it is more expensive than natural gas and communities in the vicinity of coal plants have objected to their presence for health purposes. As recently as 1988, coal-fired plants produced 57% of total electricity in the US. In 2017, only 30% of electricity was produced by burning coal. Despite this, due to the greater emission of carbon, coal produces 48% of all fossil-fuel-sourced emissions.
What do us greenhouse gas emissions look like today?
According to the Rhodium Group, which sources data from the EPA, the primary US sources of GHG are estimated as follows:
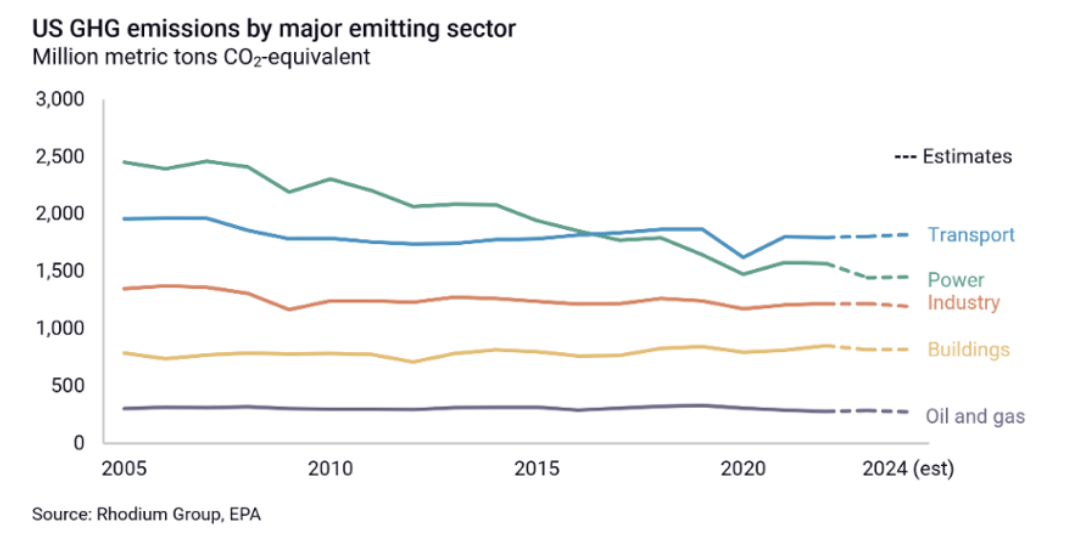
We are reliant on estimates for 2024 until official EPA data are released in spring of 2026.
Transportation: 29%: The transportation sector generates the largest share of greenhouse gas emissions. GHG emissions from transportation primarily come from burning fossil fuel for our cars, trucks, ships, trains, and planes. Over 90% of the fuel used for transportation is petroleum based, which includes gasoline and diesel. Roughly half of such emissions come from passenger cars and light-duty trucks, while the other half come from commercial freight trucks, airplanes, boats, etc.
Electricity production: 25-28%: Electricity production generates the second largest share of GHG emissions. Approximately 68% of our electricity comes from burning fossil fuels, mostly coal and natural gas.
Industry: 22%: GHG emissions from industry primarily come from burning fossil fuels for energy, as well as from certain chemical reactions necessary to produce goods from raw materials.
Commercial and residential: 13%: GHG emissions from businesses and homes arise primarily from fossil fuels burned for heat, the use of certain products that contain greenhouse gases, and the handling of waste.
Agriculture: 11%: GHG emissions from agriculture come from livestock such as cows, agricultural soils, and rice production.
Land use and forestry: 3%: Land areas can act as a sink (absorbing CO2 from the atmosphere) or a source of GHG emissions. In the United States, since 1990, managed forests and other lands have absorbed more CO2 from the atmosphere than they emit.
What are a few of the most effective strategies for fighting climate change?
Please see our Resources page for sources that describe anti-climate-change efforts, as well as this report on the actions that must be taken to limit global warming to 1.5 degrees, and efforts that have already been completed around the globe. Here are some of the strategies that, when applied globally, can effectively reduce our emissions and aid in fighting climate change:
Continue to reduce our reliance on coal: The generation of electricity is responsible for 25% of carbon emissions in the US. 60% of this generation is due to burning fossil fuels, 18.6% is from nuclear, and the balance is from renewables like hydropower, wind, and solar. Coal represents 43% of the fossil-fuel-sourced generation, while natural gas now represents 55%. New natural gas plants, however, emit 50% to 60% less carbon dioxide than new coal plants. In addition, the burning of coal contributes to respiratory disease, lung cancer, asthma, and heart attacks. It is also the largest source of toxic mercury contaminating our rivers and streams.
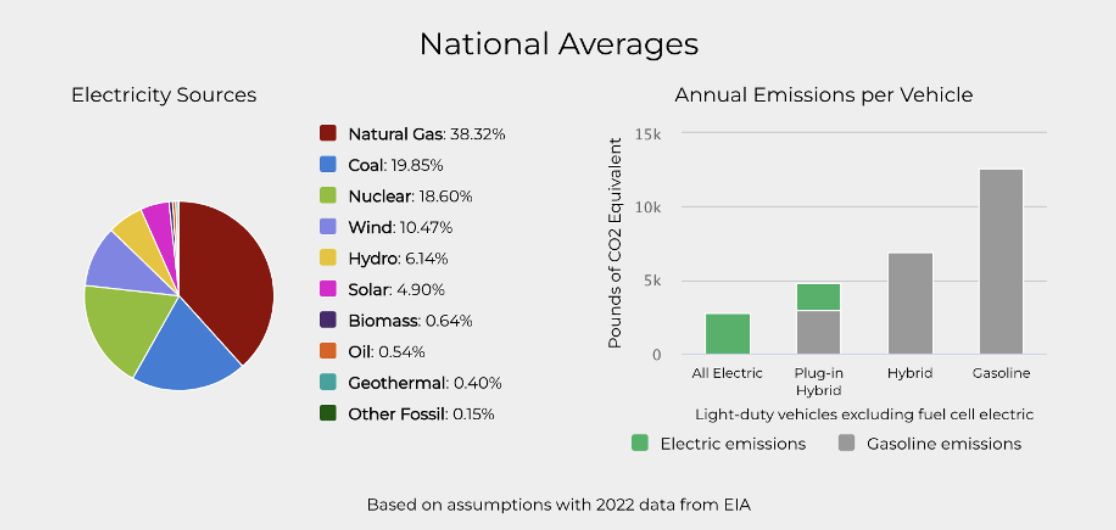
Continue to promote fuel efficiency and clean mass transportation: As noted above, transportation of all kinds is the single largest contributor of GHG emissions, at 28.5%. While trucks and cars have become more efficient over time, the number of miles driven by passenger vehicles and trucks has increased 45% since 1990. An increase in less efficient SUVs and small trucks has exacerbated the problem. Federal standards for fuel efficiency and state and federal support for electric and hybrid vehicles are important. According to the Alternative Fuels Data Center, hybrid and plug-in electric vehicles generate roughly half the “wheel to wheel” emissions of gas-fueled vehicles. (The actual amount depends on the original source of electricity.) Mass transportation is an especially cost-effective measure in cities, where cars often sit in gridlock during peak traffic hours.
The population density of cities also supports the argument for increased use of public transit. A strong mass transit system comes with many other benefits, including freeing up space in cities previously devoted to parking and reducing air pollution, which contributes to asthma and lung cancer.
Expand the carbon tax: A carbon tax is a fee charged to businesses and industries based on their CO2 output. Proposals vary, but typically the funds earned from carbon taxes go to funding renewable energy initiatives. There have been serious objections to carbon tax proposals, but it has been shown to work in areas where it’s been implemented. In 2005, the EU launched the largest carbon tax program in history, and, as of now, all 27 countries are required to participate. In recent years, other countries have taken measures to reduce carbon emissions including environmental regulations, emissions trading systems, and carbon taxes. In 1990, Finland was the world’s first country to introduce a carbon tax. Taxes range from less than €1 per metric ton of carbon emissions in Ukraine to more than €100 in Sweden, Liechtenstein, and Switzerland. In 2010, Japan launched a cap-and-trade program affecting 1,300 companies.
Continued promotion of renewables: Sources of renewable energy include the sun, wind, rain, waves, and geothermal energy.Renewable energy accounted for more than 30% of the world’s electricity for the first time in 2023, following a rapid rise in wind and solar power. The International Energy Agency also reported that over $288 billion was invested globally in renewables in 2015 and that renewables now account for as much as half of new electrical power generation. Global investment in the low-carbon energy transition surged 17% in 2023, reaching $1.77 trillion, according to Energy Transition Investment Trends 2024, a report by research provider Bloomberg NEF. Coal-burning plants are the largest producers of CO2 in the US, and large numbers of them need to be shut down globally in order to meet the 1.5 degrees C warming target.
Change how we consume food: The consumption of beef is the largest contributor to methane emissions. Limiting our beef intake in any way would help lower this output. Standardizing expiration labels would result in less food waste by consumers.
Change how we manage landfills: When biodegradables are kept separate from non-biodegradables, the biodegradables are allowed to oxidize, preventing them from generating methane.
Improve standards for buildings: The US Department of Energy estimates that residential and commercial buildings are responsible for one-third of the nation's carbon emissions. New buildings must be designed to be more efficient, and existing buildings must be upgraded to reduce energy waste, with incentives to encourage this.
What were President Trump’s first-term climate actions?
According to a Brookings Institute analysis, as of August 2020 (shortly before the end of his first term), President Trump had taken 74 actions to weaken environmental protection.
Most of these benefited extraction industries. Here are a few of the actions that the first Trump administration took to prevent efforts against climate change:
In 2015 President Obama implemented the Clean Power Plan, which for the first time set limits on carbon pollution from power plants. In 2017, EPA Administrator Scott Pruitt signed a proposal to repeal the plan.
Took steps to expand and accelerate the permitting process for oil and gas production on federal lands and loosened offshore drilling safety regulations.
Proposed policy amendments that rescinded existing standards requiring oil and gas companies to monitor and repair methane leaks, which could result in an estimated additional 5 million metric tons of methane emissions annually.
Issued a Notice of Proposed Rulemaking to freeze the fuel economy and GHG emissions standards for cars and light trucks at 2020 levels through 2026 and revoke the ability of California and allied states to set their own more stringent standards.
Loosened restrictions on coal-burning power plants, withdrawing the legal justification for a law that limited mercury emissions from coal power plants.
Dissolved two EPA advisory boards that offered guidance on environmental rulemaking: the Environmental Laboratory Advisory Board and the National Advisory Council for Environmental Policy and Technology.
Blocked State Department written testimony on climate and security by Dr. Rod Schoonover, on the basis that it included “climate alarm propaganda.”
Weakened regulations and oversight around air pollution in national parks and wilderness areas.
Approved the Keystone XL pipeline, which was then blocked by a federal judge from moving forward without an adequate environmental review process. President Trump issued a presidential permit to bypass this ruling.
Issued an executive order to scale back review of infrastructure projects under the National Environmental Policy Act, Clean Water Act, and Endangered Species Act. This scaling back was nominally in the interest of helping mitigate economic fallout due to Covid.
What were the climate actions taken by the Biden administration?
Rejoined the Paris Agreement.
Allocated approximately $370 billion via the Inflation Reduction Act of 2022 toward clean energy and climate initiatives, representing the largest climate investment in US history.
Set a goal for at least 50% of new vehicle sales to be electric by 2030, supported by consumer tax credits, loans for battery production, and incentives for automakers to retool domestic manufacturing for EV production.
Invested in expanding of the US power grid and improving its resilience, enabling greater integration of solar and wind energy, especially in rural and underserved areas.
The EPA enacted the strongest-ever national vehicle emissions standards and proposed ambitious limits on carbon pollution from fossil fuel power plants, while also issuing regulations targeting methane leaks from oil and gas operations.
Directed billions toward the clean hydrogen economy, aiming to develop regional hydrogen hubs and support innovation in low-carbon industrial processes.
Through the “America the Beautiful” initiative, the administration aimed to conserve 30% of US lands and waters by 2030, while allocating $40 billion for climate-smart agriculture and forestry to boost carbon sequestration and climate resilience in land management.
Directed federal agencies to incorporate climate risk and resilience planning into all major infrastructure and development projects, expanding the use of climate impact assessments across government.
Used executive authority to pause new oil and gas leasing on public lands and waters, though legal and political challenges led to a mixed implementation record.
Directed funds to disadvantaged communities through initiatives like the Justice40 Initiative, which aimed to ensure that 40% of federal climate and clean energy investments benefited underserved and historically marginalized populations.
Supported the development of a national climate corps, modeled after the New Deal-era Civilian Conservation Corps, to train young Americans for clean energy and environmental restoration jobs, while advancing workforce development in the green economy.
Significant resources were directed toward climate adaptation and disaster resilience, including funding for flood control, wildfire mitigation, and coastal restoration projects in vulnerable communities facing intensifying climate risks.
What have been President Trump’s second-term climate actions?
Withdrew from the Paris Climate Agreement, effective 2026.
Scaled back federal implementation of the Paris Agreement by halting progress toward President Biden’s 2030 emissions targets, effectively withdrawing US leadership from global climate efforts.
Reversed the Biden administration’s 2023 EPA rule that mandated a 56% reduction in new vehicle emissions by 2032, weakening electric vehicle targets and promoting gas-powered vehicles.
Negated President Biden’s 2022 restoration of rules that required federal infrastructure projects to consider climate impacts, streamlining fossil fuel permitting and infrastructure approvals.
Began dismantling EPA methane emissions limits finalized under President Biden in 2023, easing restrictions on leaks and flaring from oil and gas operations.
Initiated efforts to repeal or defund provisions of the 2022 Inflation Reduction Act including clean energy tax credits for wind, solar, hydrogen, and electric vehicles.
Repealed reforms by the Interior Department that had increased royalty rates for oil and gas leases and limited drilling in ecologically sensitive areas.
Halted federal investment in climate resilience programs, including coastal restoration and wildfire mitigation grants, redirecting funds toward fossil fuel development and energy infrastructure.
Disbanded or defunded several climate-focused advisory panels and interagency working groups, including those related to environmental justice and climate risk assessment.
Suspended federal support for the Climate Corps program and other green jobs initiatives, citing concerns over government overreach and budget priorities.
Approved expansion of offshore oil and gas leasing in the Gulf of Mexico and off the Atlantic coast, reversing prior restrictions and fast-tracking lease sales.
Directed the Department of Energy to prioritize domestic fossil fuel production over renewable energy research, reducing funding for solar, wind, and energy efficiency programs.
What are a few of the arguments against human-caused climate change?
Some people argue that there is no conclusive evidence that changes in global temperature can be attributed to human causes. They argue that the Earth has always warmed and cooled, driven by natural factors, like volcanoes and solar energy. Here are some of the most common arguments against human-caused climate change:
“The Earth can naturally adapt to these changes in temperature.” There is evidence that the Earth reacts to changes in the climate/ozone to ensure its own health. The issue, however, is that these natural changes can have drastic negative consequences for the human population.
“We are heading into an ice age.” This argument comes from a series of findings in the 1970s that the Earth was headed toward an ice age in about 10,000 years, and suggests that the planet’s increasing temperature due to climate change may actually turn out to be a good thing.
“Urban heat island effect.” This theory argues that the increase in global temperatures is the result of the growth of urban areas, and that as more people move to cities, the world’s temperature will increase, regardless of CO2 emissions.
Countries setting an example
The Climate Change Performance Index (CCPI) is an independent assessment of the progress that each country is making in compliance with the Paris Agreement. The index is published annually by GermanWatch in cooperation with the NewClimate Institute and the Climate Action Network. Based on their most recent findings, no country is doing enough to completely combat climate change (as you will see in the ranking below, where none of the countries included in the index receives a ranking in spots 1-3).
Applying these metrics to each country yields the following scores: