

Fiscal Policy Research
Explanation of source links:
Throughout the research below, you will find links of three types. The first and most frequent type is to primary sources such as governmental agencies. The second is to nonprofit groups that generally use government data or their own research to support their philanthropic mission. We have tried to use the least biased of these, or when in doubt, we have identified their bias. The third is to articles in periodicals or newspapers that we find to be of interest. These are not meant to be construed as original sources, and in some cases may not be accessible, depending on a reader's frequency of prior visits to the linked periodical or newspaper.
How much is the total federal government debt today?
The US government has two measures of its debt. The first is net debt, also often referred to as “debt held by the public.” This excludes obligations to government agencies such as the Social Security Administration. As of June 2025, there is approximately $28.96 trillion of such debt outstanding. The second measure is grossdebt,which is the amount the federal government owes including obligations to its own agencies. As of May 2025, this amount is approximately $36.21 trillion.
What are the components of the Federal Budget?
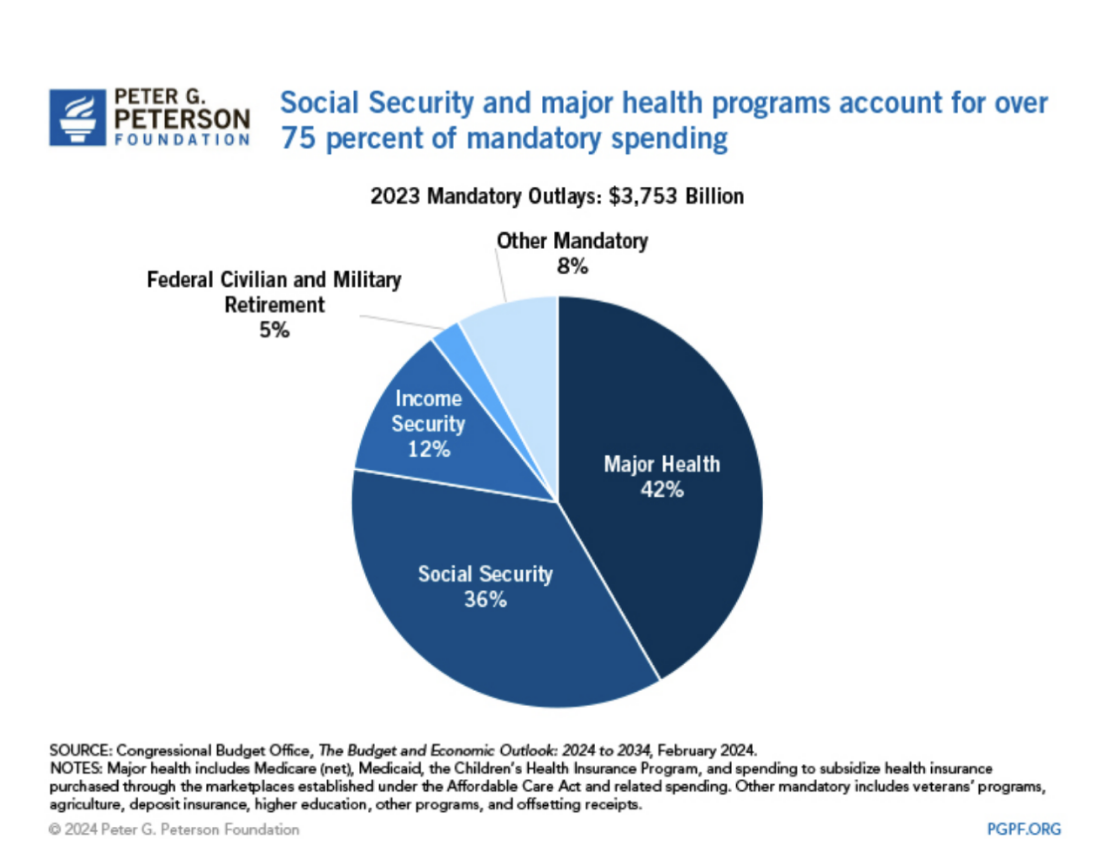
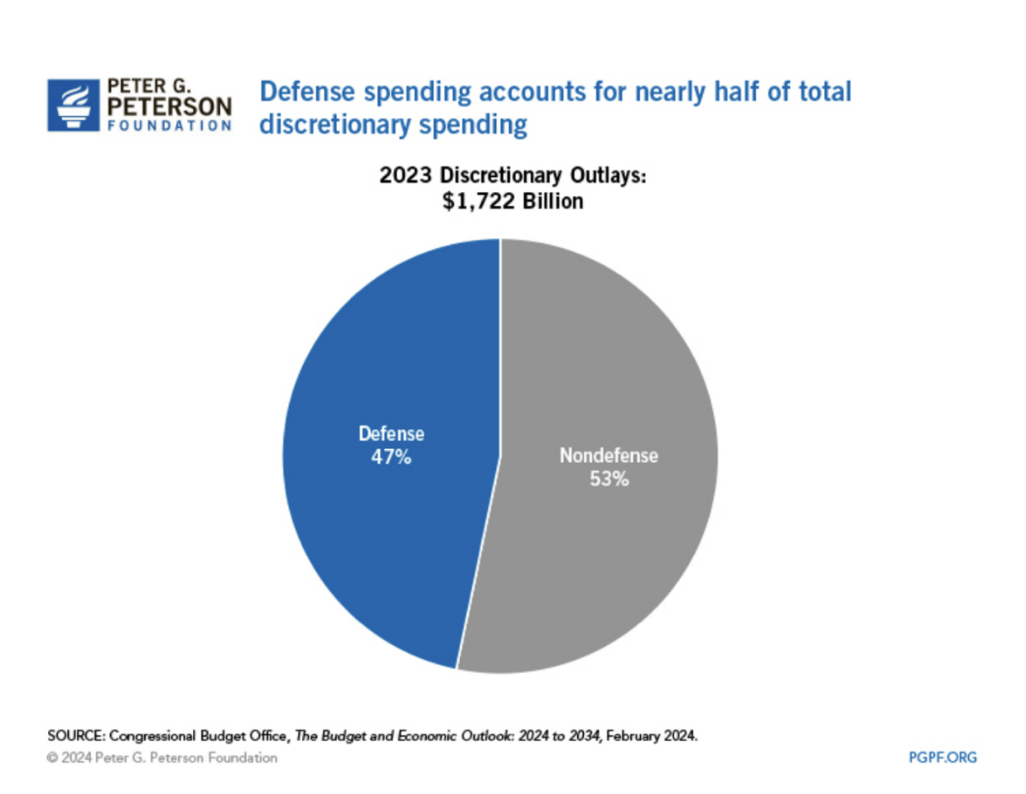
Federal budget spending is often divided between mandatory and discretionary spending. Mandatory spending includes spending that is mandated by law, meaning programs such as Social Security, Medicare, Medicaid, retirement benefits for veterans and federal employees, etc. Discretionary spending is the spending that Congress and the executive can modify and control each year. The following charts provided by the Peter G. Peterson Foundation show the spending breakdown for 2023.
How are these two components of the Federal Budget growing?
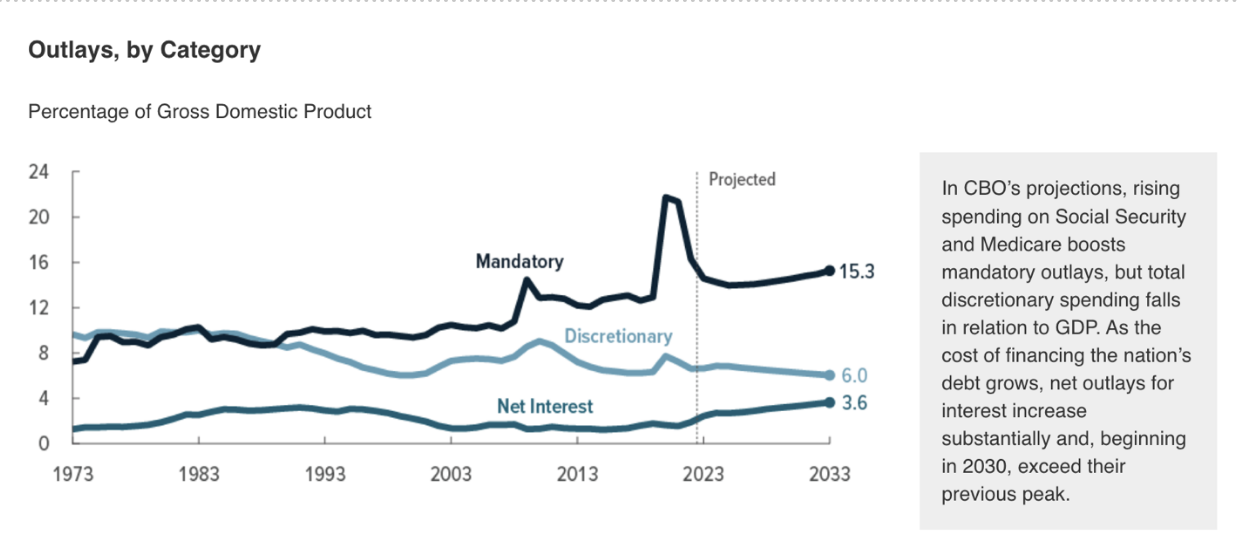
According to the Congressional Budget Office (CBO), mandatory spending has grown and is projected to grow, while discretionary spending has declined and is projected to continue to decline:
What are some of the implications of these rates of growth?
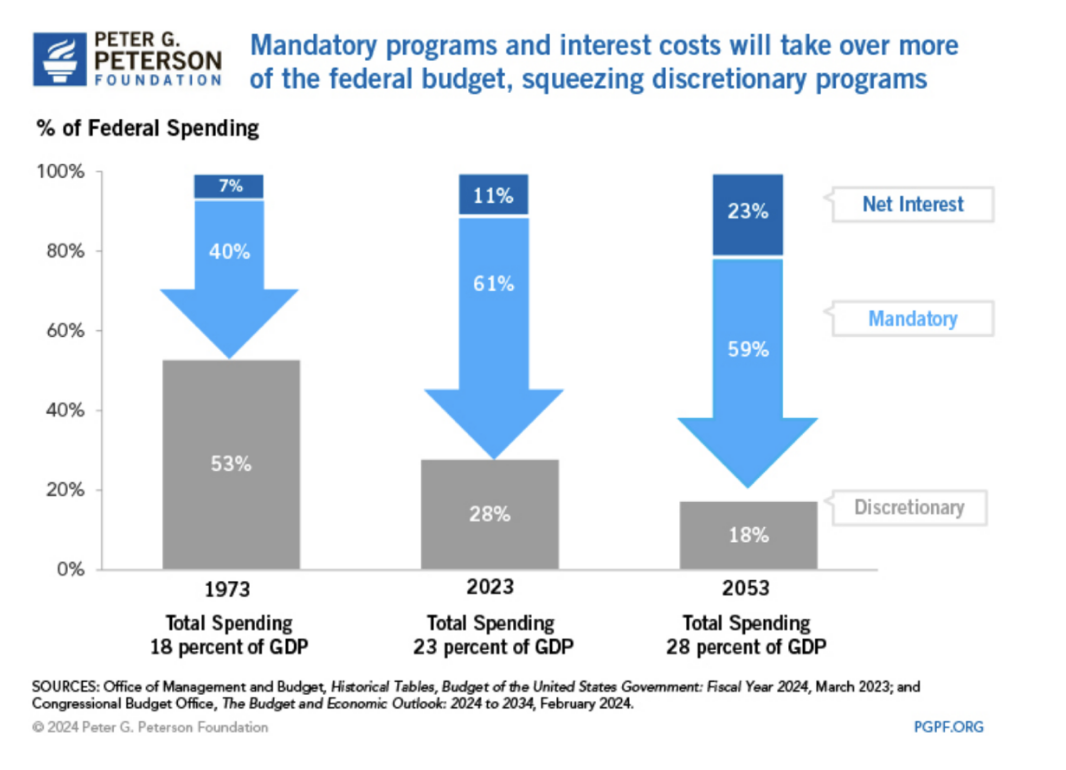
According to the Peter G. Peterson Foundation, the growth of mandatory programs will squeeze discretionary spending as follows:
What are the components of Federal Tax revenue today?
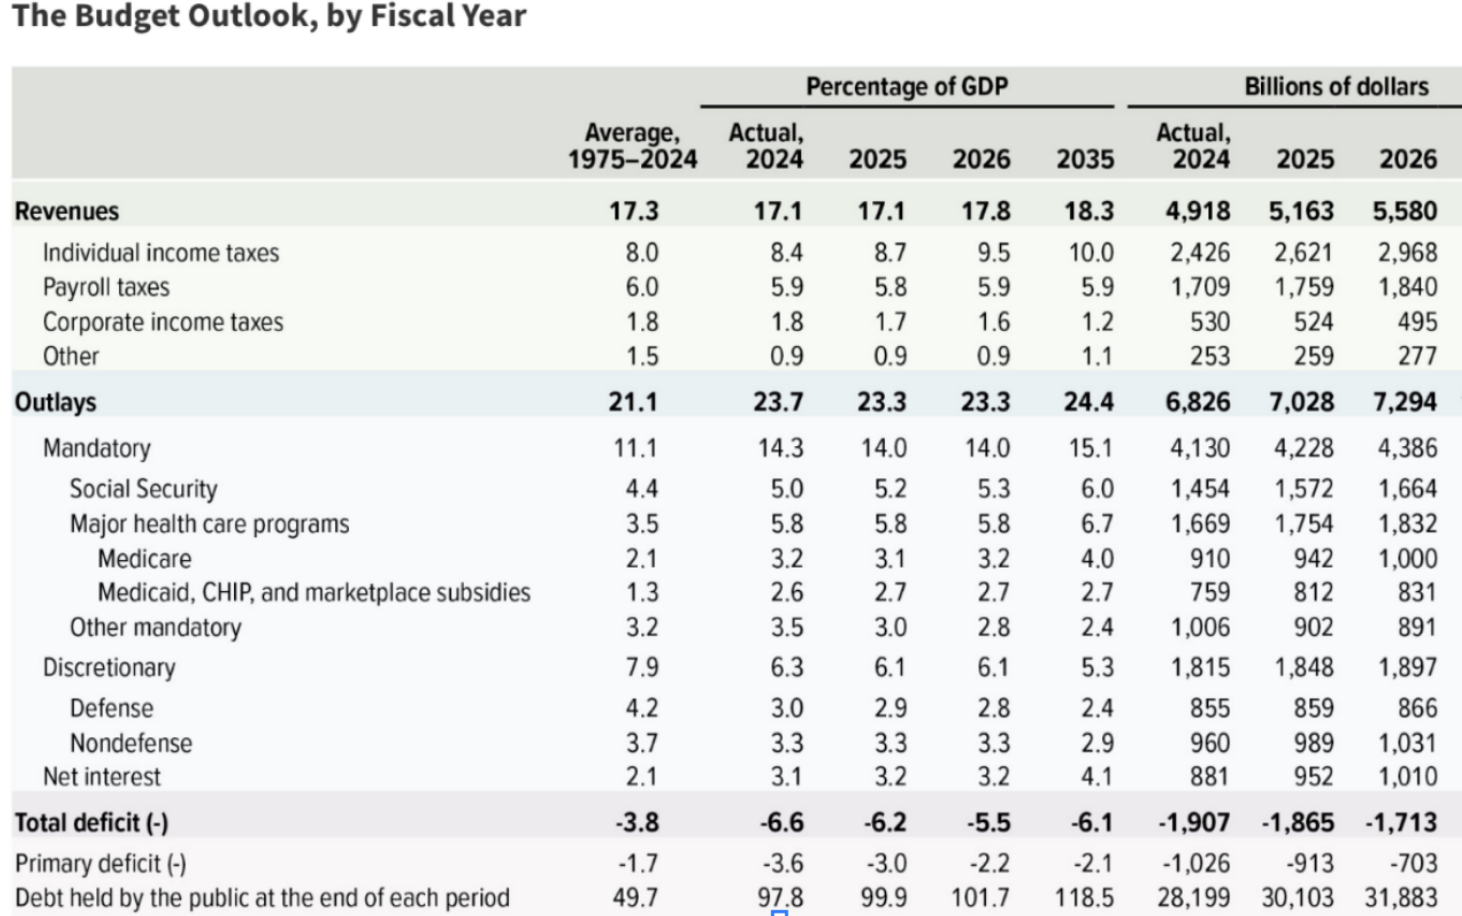
The following table shows the CBO’s projections based on current trends and the passage of the “Big Beautiful Bill,” in dollars and percentage of gross domestic product (GDP).
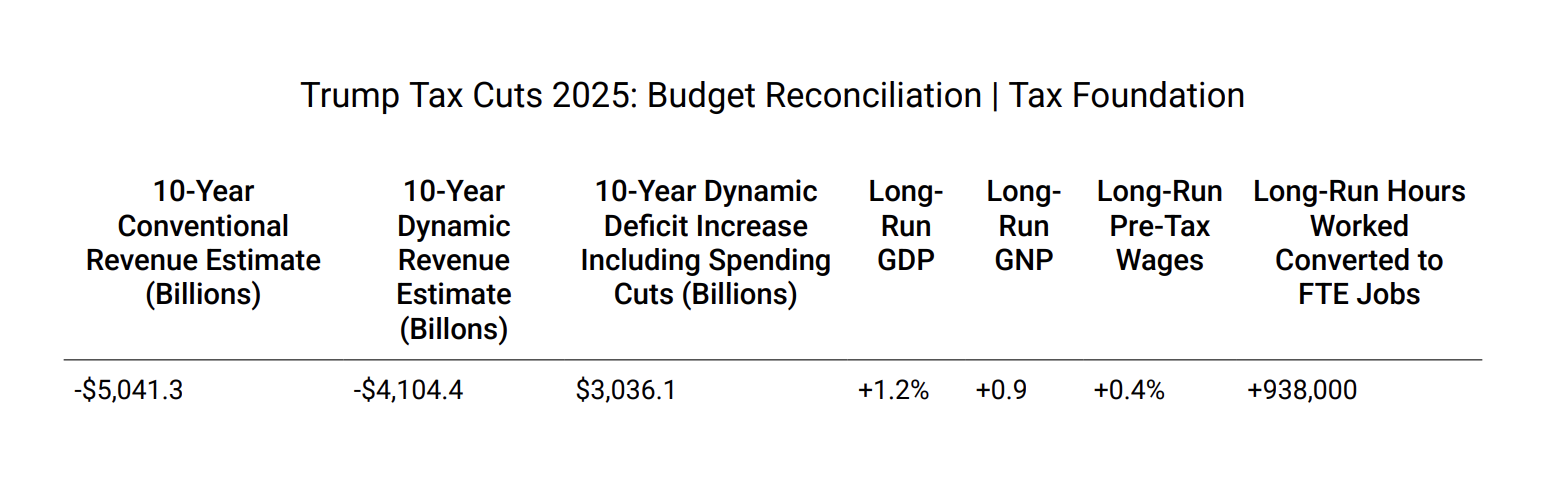
The Tax Cuts and Jobs Act, passed by President Trump’s first administration, included a series of tax cuts that were projected to expire in July of 2025. These cuts were renewed by President Trump’s second administration in July of 2025. However, the CBO data above were calculated before the renewal. The following table shows the projected impact on revenue of the renewed tax cuts, using data from the Tax Foundation, as of July 4, 2025.
How rapidly is the total federal debt accumulating?
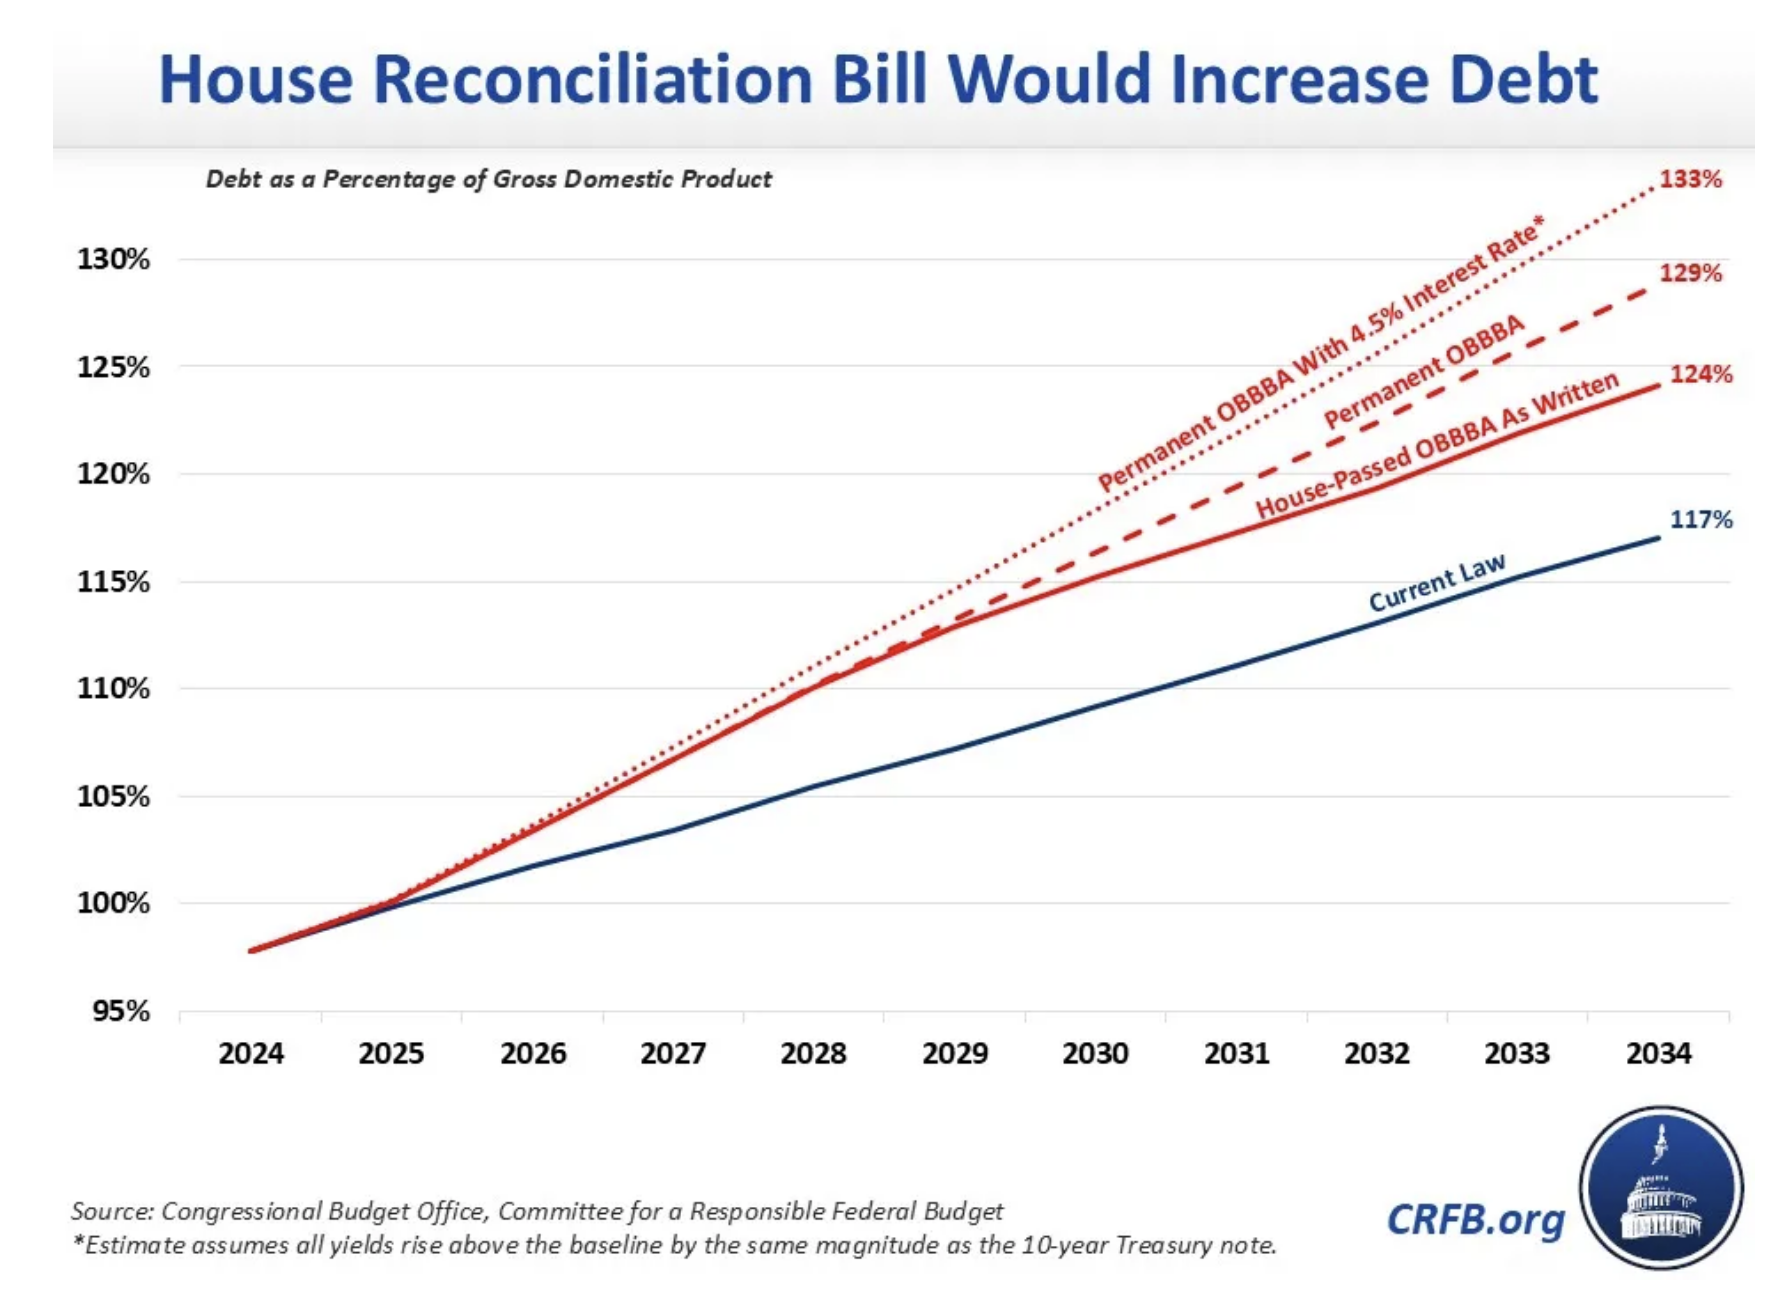
According to the CBO, based on current spending in excess of tax revenue, the federal government will borrow, on average, $2 trillion every year for the foreseeable future. However, this estimate did not include the effects of the “Big Beautiful Bill.” As reported by Committee for a Responsible Federal Budget, the CBO predicted the following effects of the “Big Beautiful Bill” on the federal debt in the coming years:
Increase debt by nearly $3 trillion, or roughly $5 trillion if made permanent.
Increase the deficit to 7.0% of GDP by 2026.
Double interest costs between 2024 and 2034 to $1.8 trillion (4.2% of GDP).
Who owns the federal debt?
US citizens (as individuals via mutual funds, insurance companies, and the government itself) own $22 trillion (of the total $29.4 trillion). The remaining balance of $7.4 trillion is held by foreign countries: Japan holds the most at $1.13 trillion, followed by the UK at $779 billion, China at $765 billion, and the Cayman Islands at $455 billion.
Among US government holders, as of 2025, the Federal Reserve is the largest holder at $4.6 trillion.
As of 2024, the Social Security Trust Fund (SSTF) was the second largest holder at $2.5 trillion. This is the result of the fact that the SSTF has run surpluses throughout its history and has invested those surpluses in government securities.
What is the current interest expense on the federal debt?
In budgeting for interest expense, the federal government uses interest on net debt, excluding interest paid to governmental agencies. Although this effectively understates the true cost of its debt, the impact of this will not be significant until the SSTF depletes its surplus and the federal government is required to externally refinance its obligations. (See below.) CBO estimates, therefore, are also based on the net debt amount. Interest expense is projected to increase to over $1 trillion annually by 2026, and $1.8 trillion by 2035.
How do you measure whether a country can support its debt?
Analysts typically look at several measures of debt serviceability, including ratios of debt to GDP, interest expense to GDP, and interest expense to total government spending.
Based on these measures, what is the history of federal debt?
The following chart provided by the Pew Research Center shows the increase in total debt as a percentage of GDP through 2022.
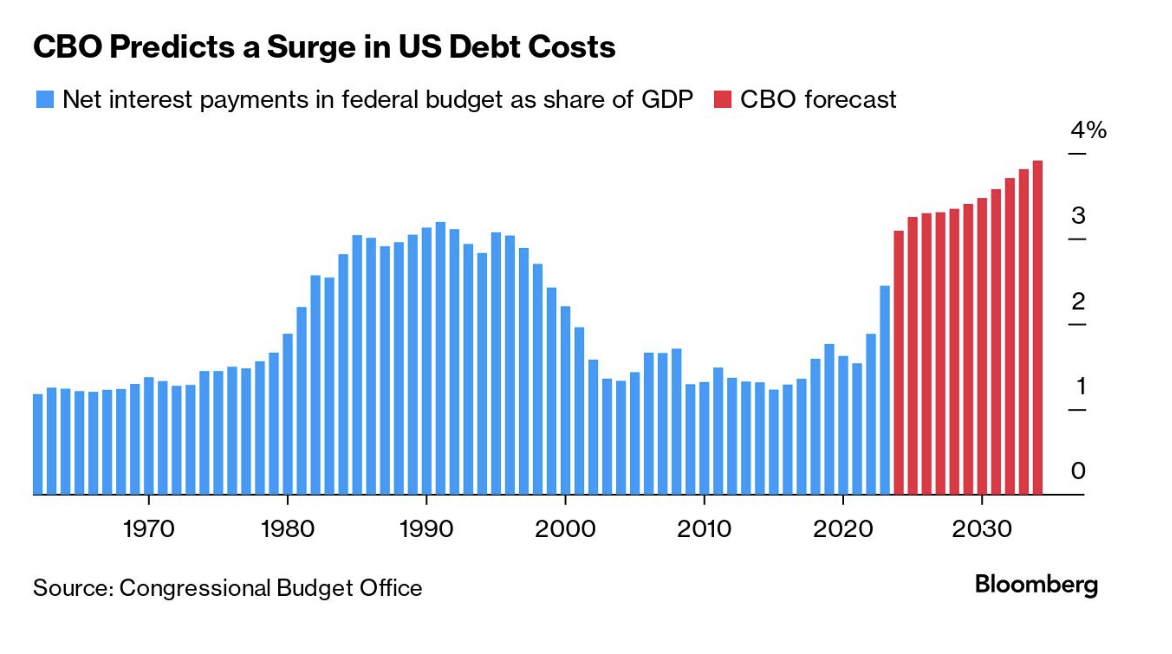
Despite this growing level of debt, due to declining interest rates over the past 20 years, interest expense as a percentage of GDP has remained relatively constant. Based on CBO estimates, however, that trend is expected to change in the future.
What is the total of state and local debt?
State and local debt was approximately $3.37 trillion as of the fourth quarter of 2024. Unlike federal government debt, state and local debt has remained stable as a percentage of GDP for several years. These debts vary state by state, the top five of which range from $221 billion owed by Texas to $498 billion owed by California.
How does state and local debt affect the foregoing measures?
Per the US Treasury, as of 2024, state and local government debt added approximately $1.5 trillion to the national debt. However, it is not included in traditional measures of national debt size such as debt-to-GDP ratio. As a result, such analysis understates the true debt burden of our country.
Based on projected increases in the national debt, how will interest expense increase?
The following table and chart show the CBO’s projections of increased interest expense based on the passage of the “Big Beautiful Bill.”
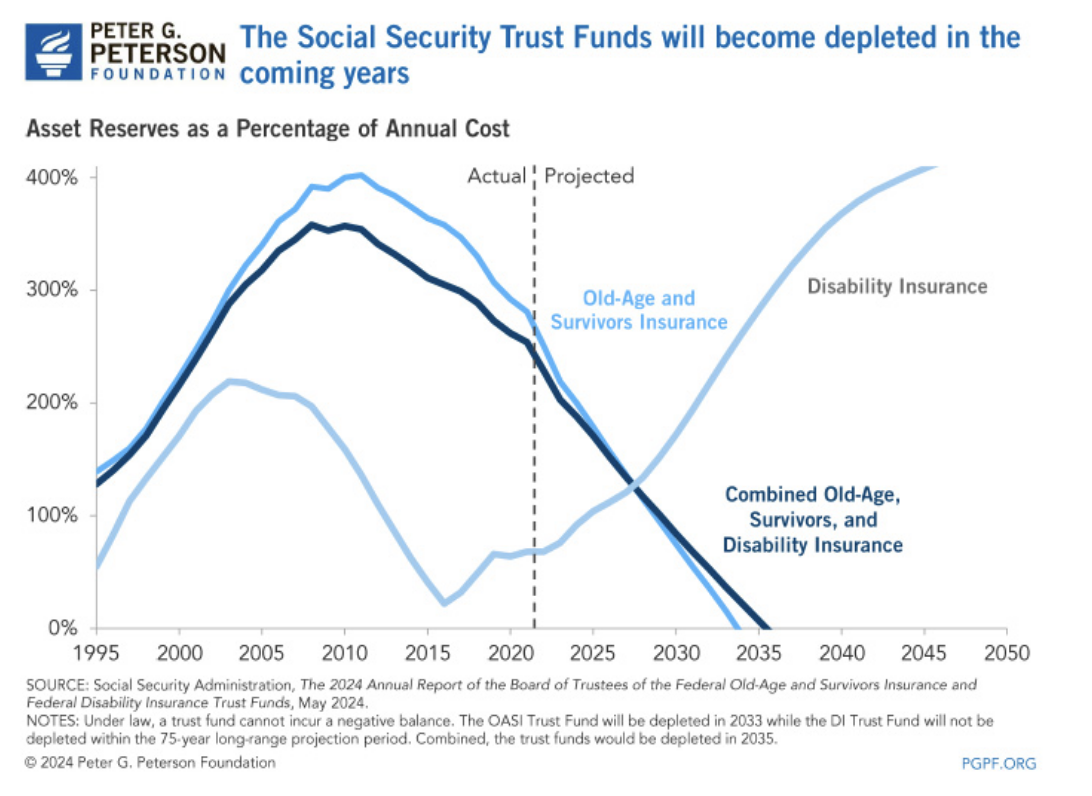
But this only tells part of the story. Based on numbers from the Social Security Administration, the Peter G. Peterson Foundation projects that the entire $2.8 trillion Social Security reserve is projected to be exhausted by 2034. Thereafter, Social Security will run an annual cash flow deficit of $250 to $400 billion. This means that the federal government deficit will increase in those years by the same rate as Social Security benefits are reduced or taxes are increased.
If interest rates increase, what could happen to the level of interest expense?
Based on the CBO’s 2025 projections, net interest on the federal debt will total approximately $952 billion in fiscal year 2025, accounting for about 14% of total federal outlays. If interest rates remain at current levels and debt continues to grow, interest payments are projected to exceed $1.6 trillion by 2033, comprising roughly 20% of the federal budget. If interest rates were to double from current levels, total interest expense could reach or exceed $2 trillion by 2033, potentially consuming over 25% of federal outlays.
What does the federal government say about this level of debt?
In CBO’s 2025 baseline after accounting for all of the government’s borrowing needs, debt held by the public is projected to rise from approximately $28.9 trillion at the end of fiscal year 2025 to $46.7 trillion by the end of 2035. As a percentage of GDP, that debt is projected to increase from 99% in 2025 to 118% in 2035. At that point, federal debt held by the public would exceed its previous post-World War II peak.
Consequences of Growing Debt
If federal debt as a percentage of GDP continued to rise at the pace that CBO projects it would under current law, the economy would be affected in two significant ways: That growing debt would dampen economic output over time, and rising interest costs associated with that debt would increase interest payments to foreign debt holders and thus reduce the income of U.S. households by increasing amounts.
The increases in debt that CBO projects would also pose significant risks to the fiscal and economic outlook, although those risks are not currently apparent in financial markets. In addition, high debt might cause policymakers to feel constrained from implementing deficit-financed fiscal policy to respond to unforeseen events or for other purposes, such as to promote economic activity or strengthen national defense. Negative economic and financial effects that were less abrupt but still significant—such as expectations of higher inflation or an increased burden of financing public and private activity—would also have a greater chance of occurring. Those effects would worsen the consequences associated with high and rising federal debt. To put debt on a sustainable path, lawmakers will have to make significant changes to tax and spending policies—increasing revenues more than they would under current law, reducing spending below projected amounts, or adopting some combination of those approaches.
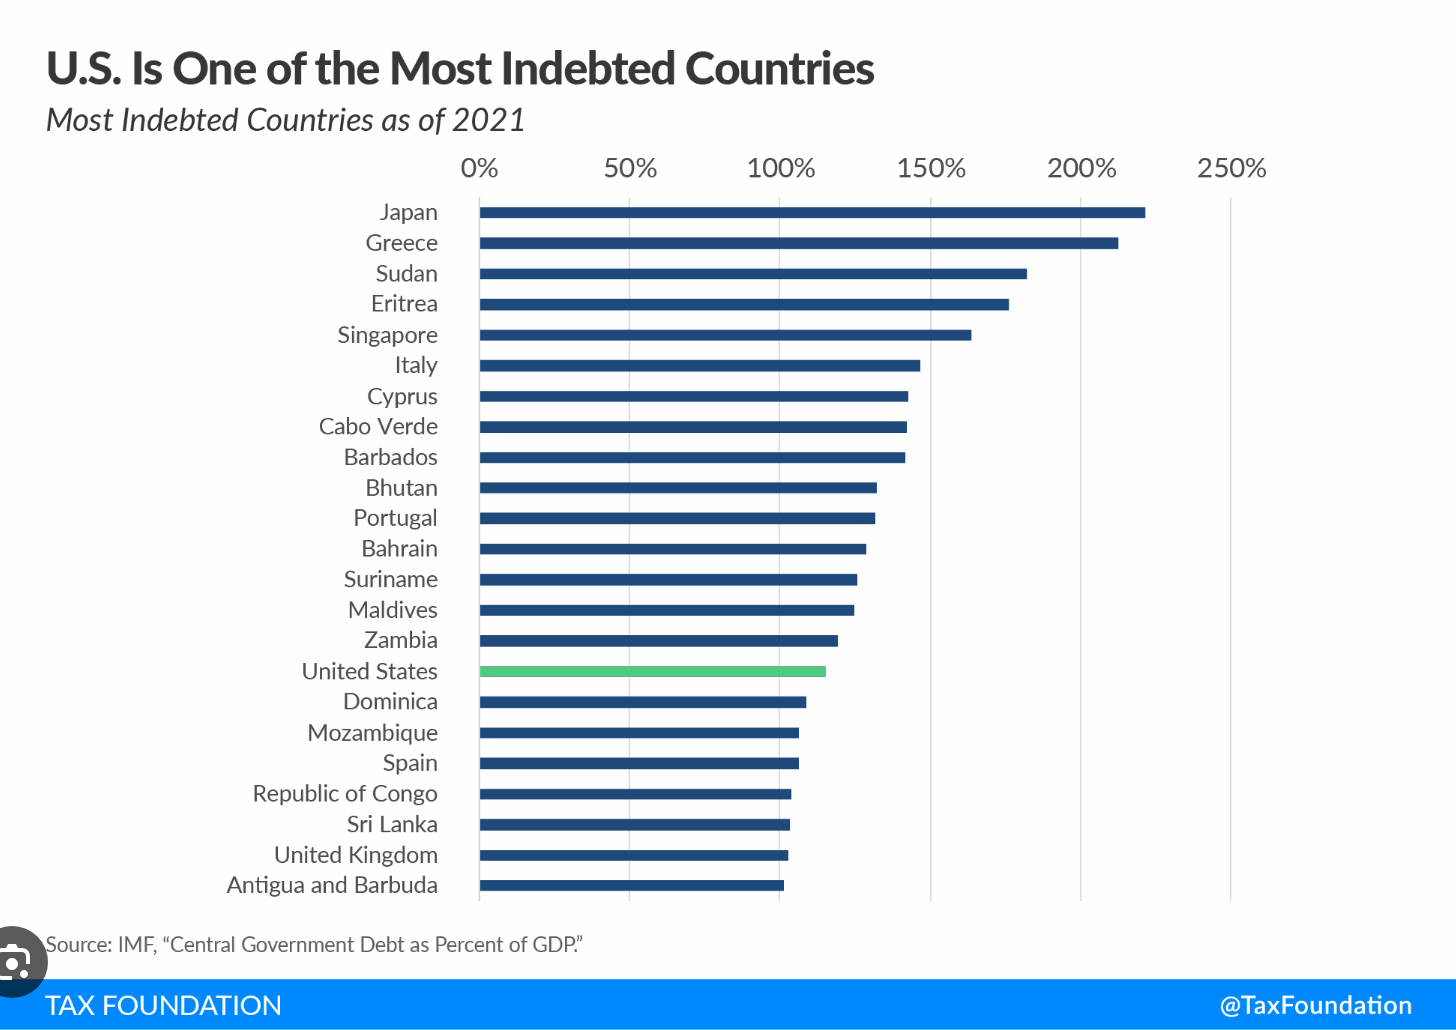
How do these Gross debt levels compare to other developed countries?
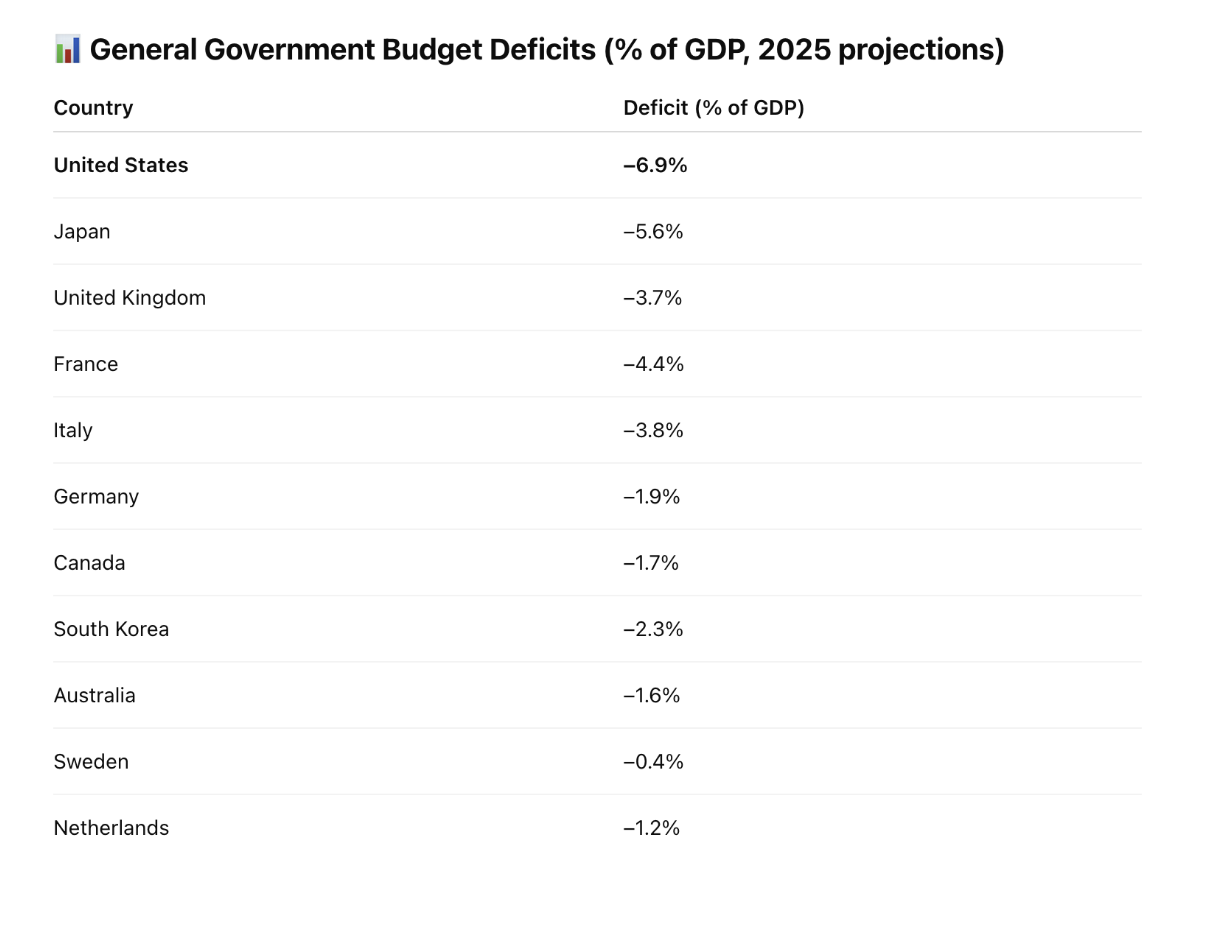
How does our annual deficit relative to GDP compare to the same countries?
According to data taken from the OECD’s annual report, the US leads the developed world in budget deficit as a percentage of GDP.
Third world countries have a history of failure, but do developed countries like the US really fail?
Yes; in fact, several countries, including Spain, Greece, Ireland, and Cyprus, all failed or required assistance during the recent financial crisis. Italy continues to struggle with unsustainable debt levels. Here is a brief history of financial failures in Spain and Greece:
Not unlike the US, Spain experienced a prolonged increase in housing prices during the 1990s and in the early 2000s (now referred to as a housing bubble). Both banks and consumers were highly leveraged and exposed to the risk of a decline in prices. When the financial crisis hit, Spain experienced a significant decline in real estate prices, the beginning of a prolonged economic recession, and the failure of much of its banking sector. Although Spain’s public debt at the time was a seemingly manageable 36.2% of its GDP, its capacity to borrow was not sufficient to bail out its financial sector. In 2012, the EU began providing up to €100 billion in loans both directly to Spanish banks and to the Spanish government.
Greece entered the Great Recession with estimated deficits between 6% and 15% of GDP and total debt between 113% and 130% of GDP. These numbers are estimates because Eurostat discovered the Greek government reported inaccurate numbers. As the country slid into recession, tax revenues declined and deficits and total debt increased dramatically. Greece, like Spain, was unable to provide necessary support to its financial institutions. The country was also unable to finance its own deficit spending. Since 2011, Greece has been in a perpetual state of crisis, requiring several bailouts from the European Community, as well as several restructures and debt forgiveness.
What were President Biden’s fiscal policies and how have their effects been felt?
In response to the COVID-19 pandemic, the Biden administration enacted the $1.9 trillion American Rescue Plan, which included direct payments, expanded unemployment benefits, and aid to state and local governments. Subsequent legislation, including the Bipartisan Infrastructure Law and the CHIPS and Science Act, funded transportation, broadband, semiconductor manufacturing, and clean energy projects. The resulting federal spending contributed to a sharp increase in inflation, which peaked at 9.1% in June 2022 before gradually declining. Cumulatively, these measures added about $4.7 trillion to ten-year federal debt projections, with annual deficits averaging $1.9 trillion through FY2024. By FY2025, debt held by the public reached 100% of GDP, and net interest payments grew to 3.2% of GDP.
What is DOGE and what has it accomplished?
The Department of Government Efficiency (DOGE) was created by President Donald Trump in January 2025 by renaming the US Digital Service. It was led by Elon Musk and tasked with eliminating $2 trillion in federal spending. In 130 days, DOGE claimed $175 billion in savings, though independent estimates reported less. The department executed mass layoffs, shuttered agencies, and seized the U.S. Institute of Peace building. Multiple lawsuits were filed challenging its actions and constitutionality. DOGE staff identities were withheld from the public, and internal decision-making processes were not disclosed.
What is the “Big Beautiful Bill”?
The “One Big Beautiful Bill Act,” signed into law by President Trump in July 2025, is a Republican-led legislative package aimed at reducing federal spending by $2 trillion over ten years. The act extends most individual and business tax provisions from the 2017 Tax Cuts and Jobs Act, including lower individual income tax rates, expanded standard deductions, and the 20% deduction for pass-through income. According to the CBO, the act will reduce federal revenues by approximately $3.5 trillion over ten years. This revenue loss, combined with higher interest costs, will increase federal debt held by the public by about $3 trillion by 2034.
It includes provisions for full and immediate deductions on qualified equipment purchases, reinstates immediate deductions for research and development expenses, and expands deductions for business loan interest, retroactive to January 2025 and set to expire by 2029 or 2030. The act also includes cuts to Medicaid, prompting debate over potential benefit reductions.