

Healthcare Research
Explanation of source links:
Throughout the research below, you will find links of three types. The first and most frequent type is to primary sources such as governmental agencies. The second is to nonprofit groups that generally use government data or their own research to support their philanthropic mission. We have tried to use the least biased of these, or when in doubt, we have identified their bias. The third is to articles in periodicals or newspapers that we find to be of interest. These are not meant to be construed as original sources, and in some cases may not be accessible, depending on a reader's frequency of prior visits to the linked periodical or newspaper.
Important clarification of terms
The public healthcare discussion often confuses terms and morphs several questions that should be examined and debated separately.
The first question is about the quality of US healthcare: Is it better or worse than what is available in other countries?
The second question is about the cost of US healthcare: Is it priced fairly and similarly to the healthcare of other countries?
The third question is about administration and payment: Is the method of administration and payment an efficient one?
The question of quality: how does the US compare to other countries?
There are several common measures used to compare the quality of health care across countries. Unfortunately, the US ranks toward the bottom on every single one of them. The relevant data are broadly available from multiple sources and not generally disputed. We have relied heavily on the Commonwealth Fund for this discussion; its Multinational Comparison of Health Systems Data, last compiled in 2021, is particularly useful.
Measure One: Avoidable Mortality: This is defined as “deaths before age 75 from conditions that are at least partially modifiable with effective medical care.” In 2024, the US ranked last in avoidable mortality among 11 high-income nations, according to the Commonwealth Fund’s report “Mirror, Mirror 2024.” This ranking reflects the country’s persistent health system challenges, despite its high health care spending. The US recorded 177 preventable deaths per 100,000 people.
Measure Two: Major Disease Survival Rate: Per the Commonwealth Fund’s “Mirror, Mirror” report, the US ranked comparatively better in some areas in 2024, but still fell behind many peer nations. For example, the US had a lower 30-day mortality rate for ischemic strokes than the average of other countries (4.3% vs. 6.2%), but had higher hospital admission rates for chronic conditions like diabetes and congestive heart failure, which could be minimized through better primary care.
Measure Three: Deaths Due to Surgical or Medical Mishaps: The Commonwealth Fund also reported that the US ranked poorly in this category. For example, Americans have the worst survival rate after kidney transplants. A Johns Hopkins study done in 2014 found that over 250,000 deaths occur in the US yearly as a result of medical mishaps, like adverse drug reactions or botched/unnecessary surgeries. Studies published on Norway and the United Kingdom put the rate of preventable hospital deaths at 4.2% and 5.2%, respectively, which would translate to 25,000 to 30,000 deaths a year in a country the size of the US.
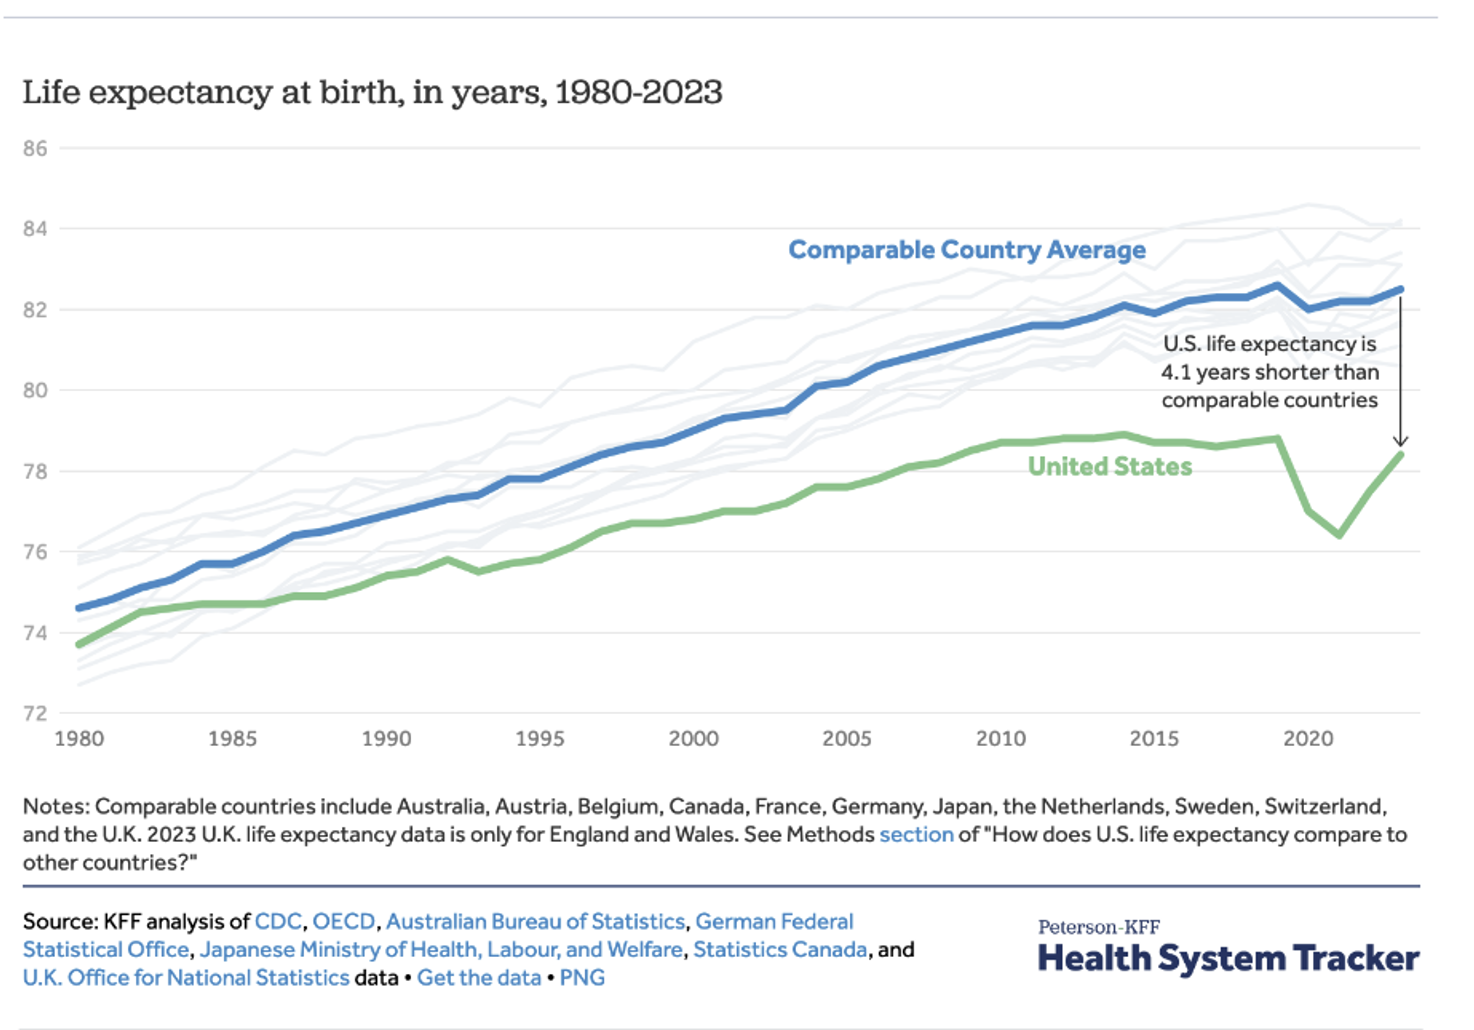
Measure Four: Life Expectancy: According to the Organisation for Economic Co-operation and Development (OECD), in 2022 life expectancy in the US was 4.1 years shorter than comparable countries.
Measure Five: Infant Mortality: According to Peterson, as of 2023, the average rate of infant mortality among OECD countries was 4.0 deaths per 1,000 live births in 2021. At 5.4 deaths per 1,000 live births, the US ranked 33 among the 38 OECD countries, falling between the Slovak Republic (4.9 deaths per 1,000 live births) and Chile (5.8 deaths per 1,000 live births).
Measure Six: Healthy Life Expectancy at Age 60: Since the US has a lower life expectancy at birth than other wealthy countries, analysts think it is helpful to examine how long someone aged 60 might expect to live. According to the 2024 Commonwealth Fund report, the US ranked lowest on this measure among 11 high-income countries surveyed.
Measure Seven: Access to Health Care Services: According to 2021 OECD data, the US had 2.6 practicing physicians per 1,000 people—lower than countries like Italy and Spain, which had 4.0 and 3.9 physicians per 1,000 people, respectively. Additionally, the US had 2.8 hospital beds per 1,000 people, placing it behind many other wealthy nations. For instance, South Korea, which has been highlighted for its health care efficiency, boasted 12 hospital beds per 1,000 people. The US has relatively more nurses per capita, but a significant portion of the health care work force is in non-clinical roles, limiting the direct care available.
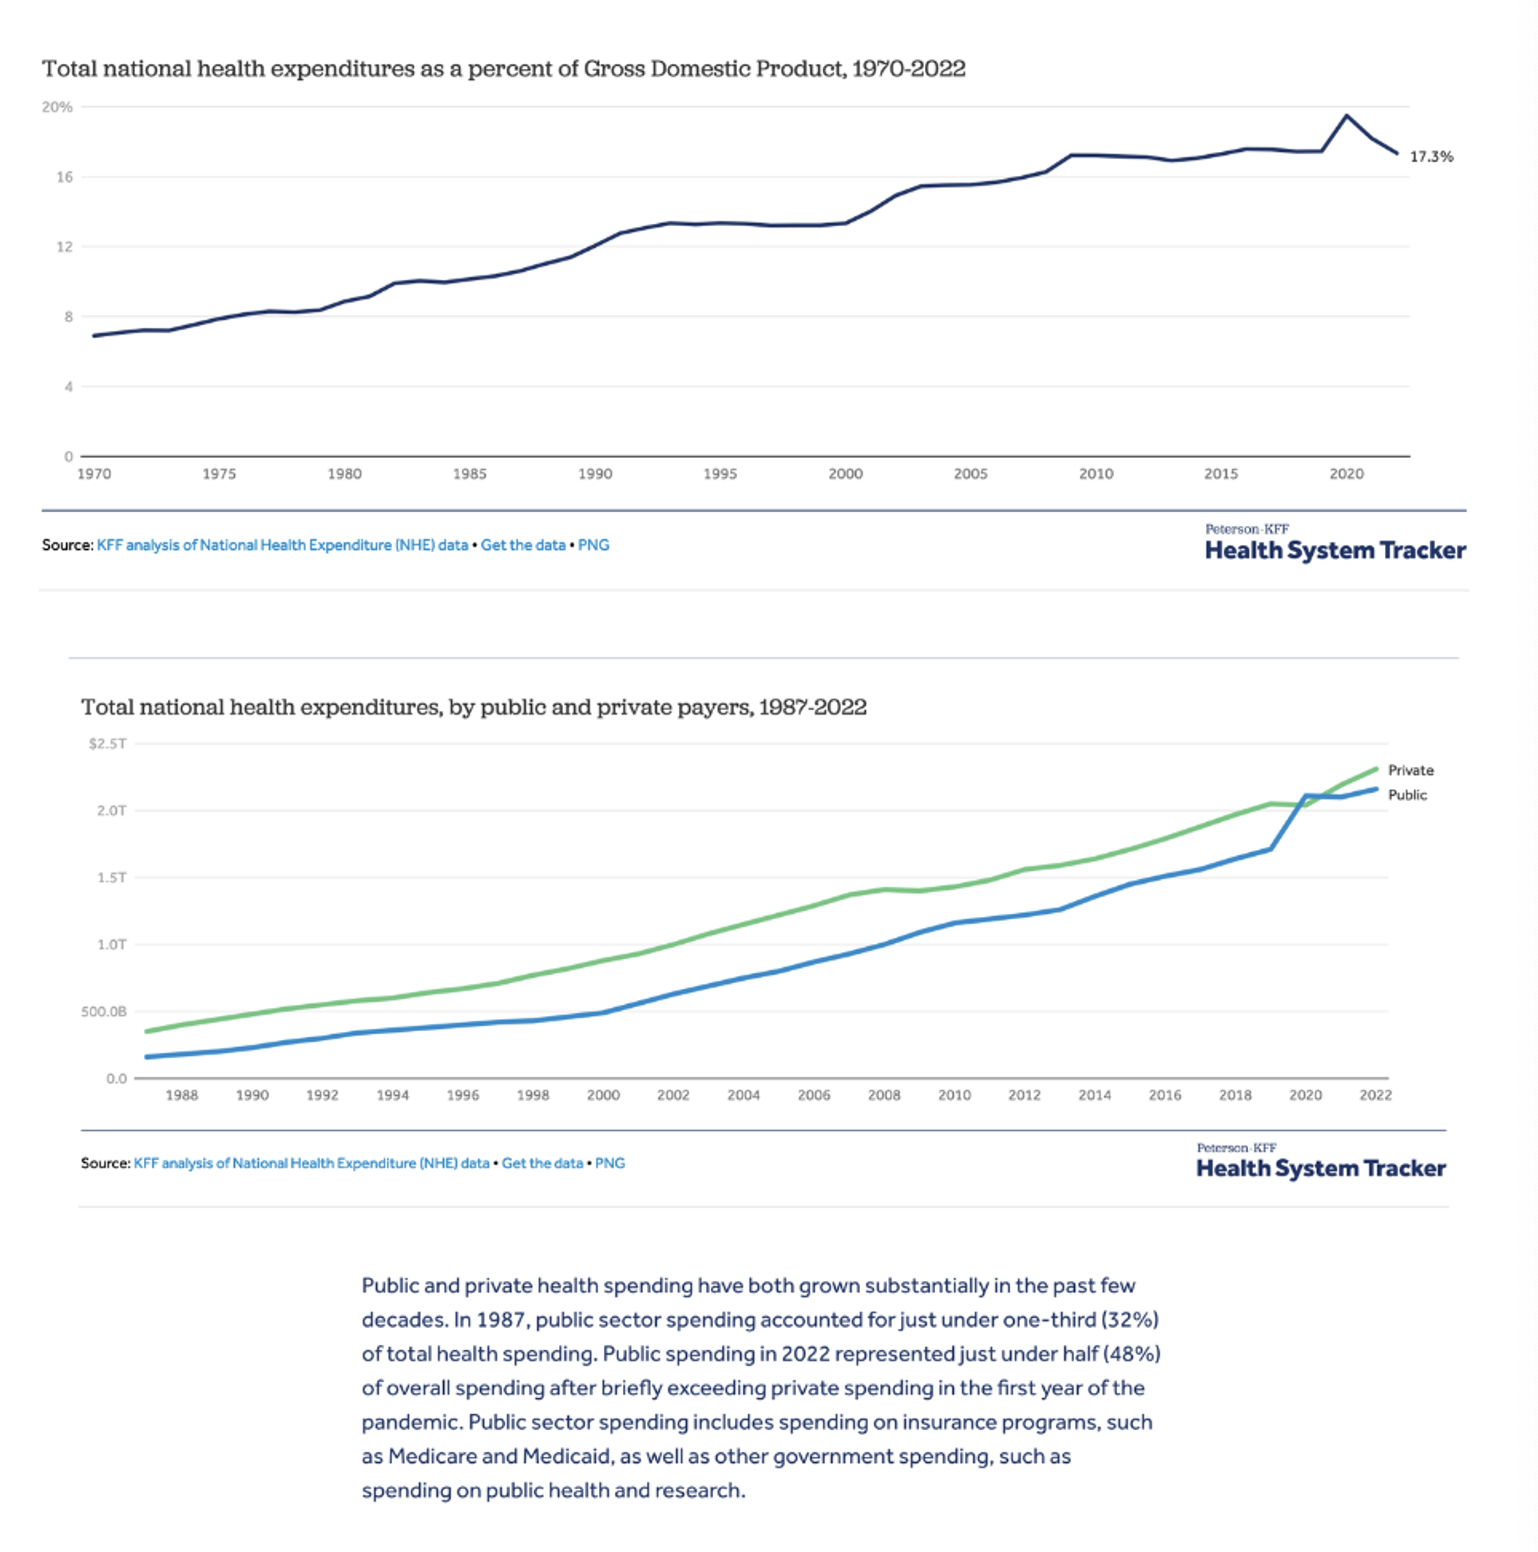
The question of cost: is it true that the US spends more on health care than other developed countries?
Yes. The most common measurement of health care spending is total spending as a percentage of a country’s gross domestic product (GDP). In this category, the US spends far more than the countries compared below, which all provide universal health care to their citizens.
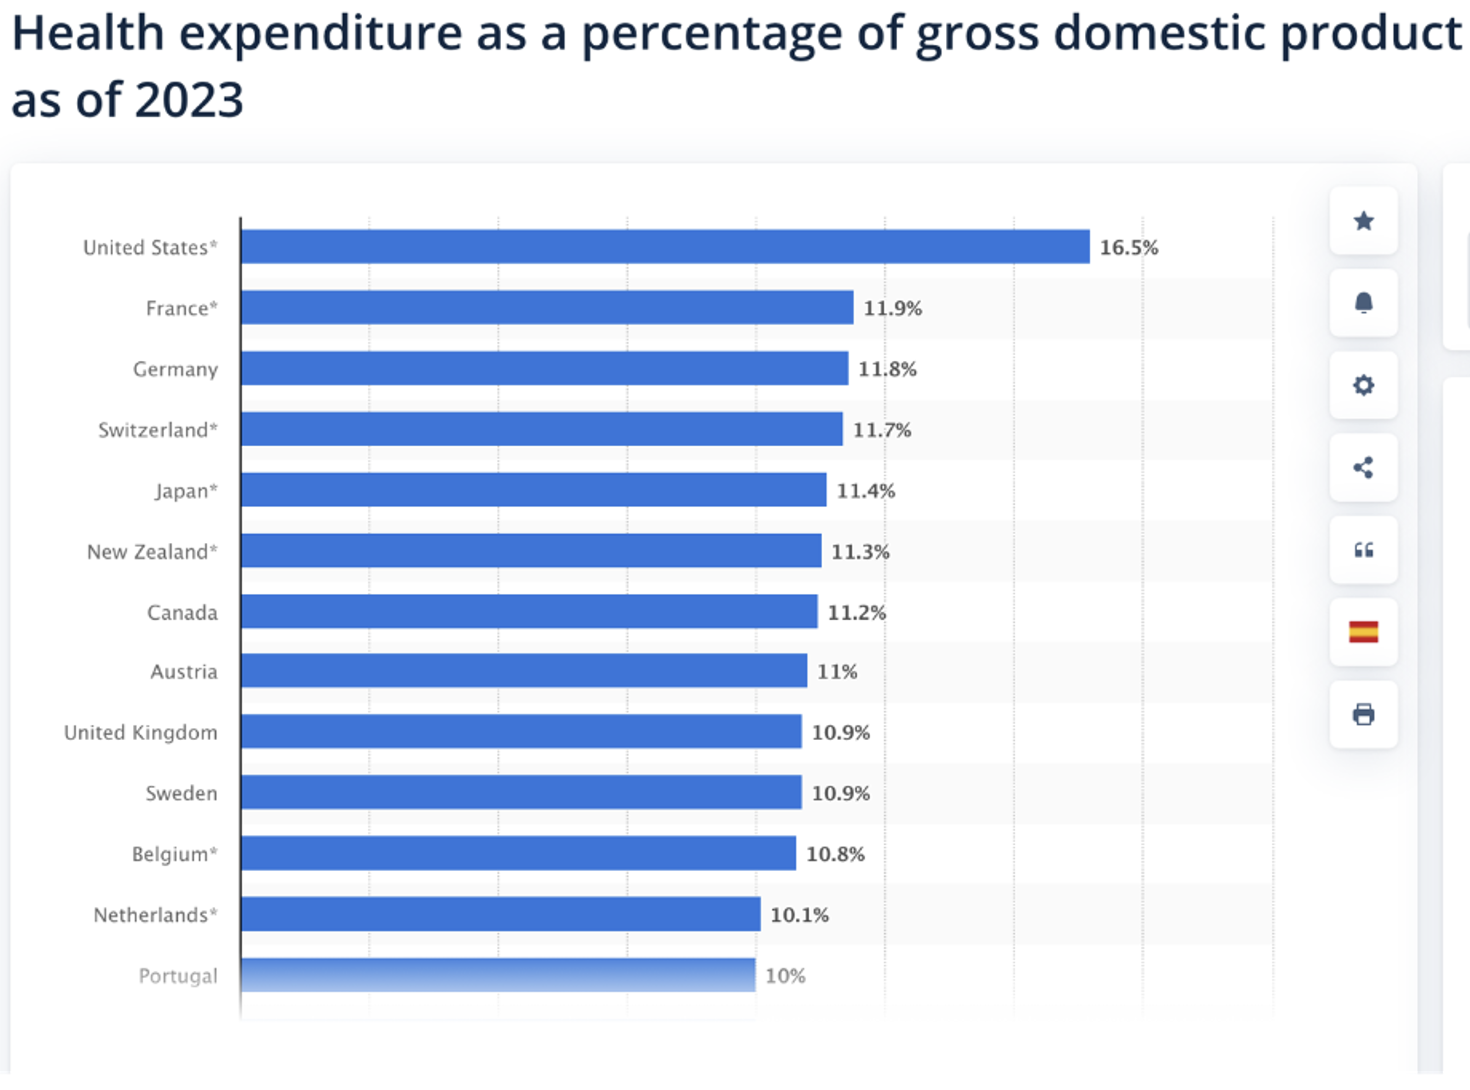
Source: Statista.
Using the measurement of health care expenditures per capita, the US also spends more than any other OECD country.
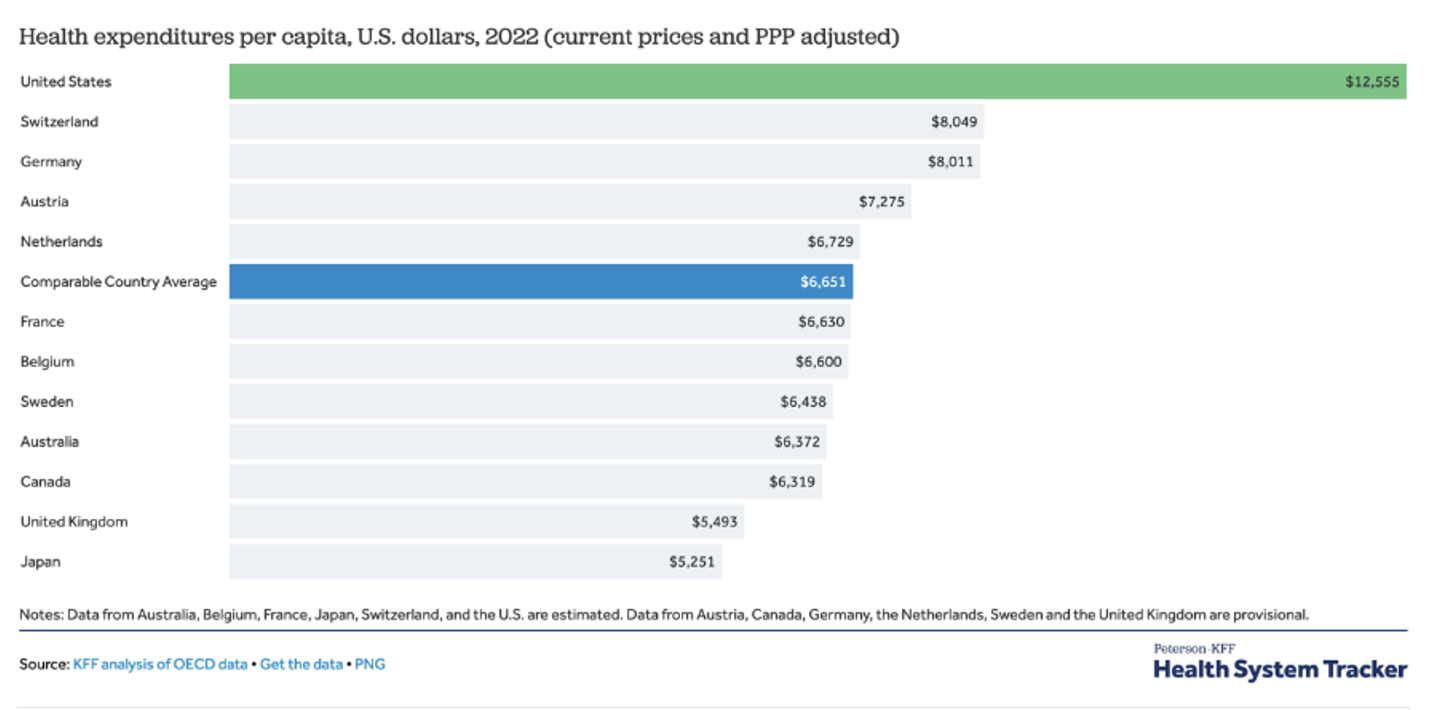
Source: Kaiser Family Foundation
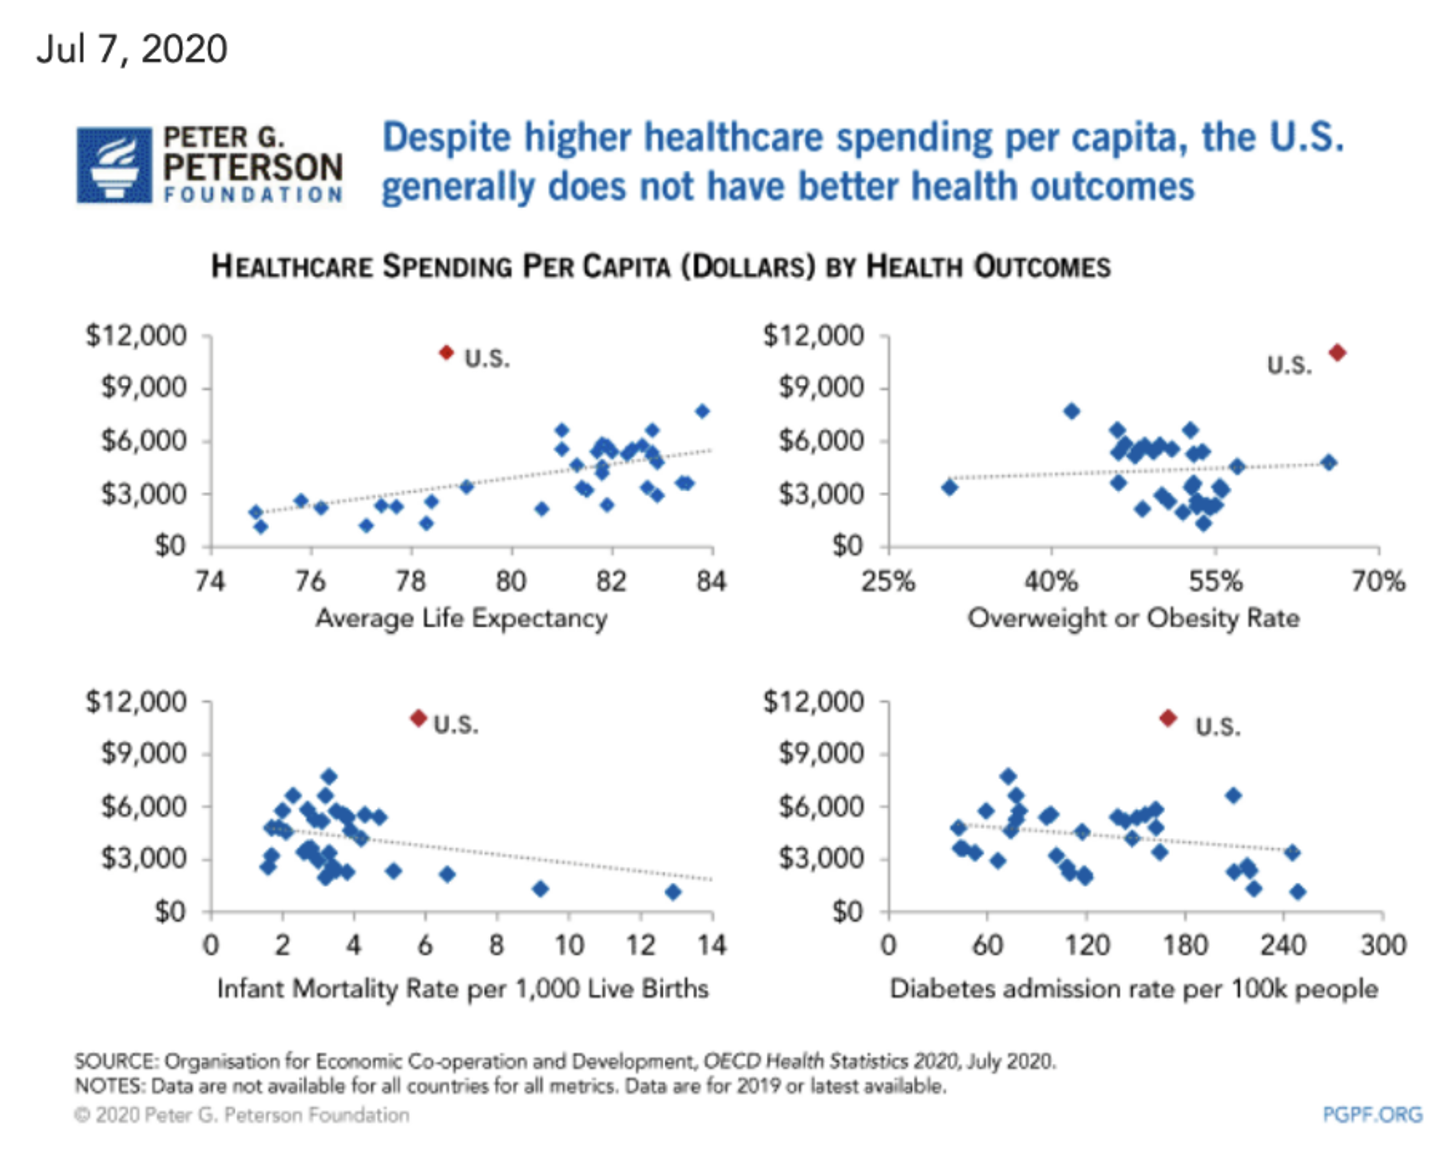
The Peter G. Peterson Foundation provides a useful merger of these two concepts: spending versus outcomes in four different measurement categories. Again, the US spends more for less in each of them.
The question of administration and payment: is the US as efficient as comparable countries?
There are several reasons that the US spends more on health care compared to other countries, all of which we will discuss here. The most significant, however, is health care administration and payment in the US. This can be broken down into two major factors:
Private insurance company delivery: Unlike most other developed countries, the US administers non-Medicare and Medicaid payments for health care through a system of private, for-profit health insurance companies. The insurance company has several responsibilities in this system: underwrite (meaning choose whom to insure and whom not to); review claims and determine which to pay or deny; negotiate prices with caregivers, hospitals, and drug companies; and make a profit. When you take all of this expense into consideration, the average insurance company pays out about 80% of the premiums that it collects. This compares to 97% for Medicare, with administrative costs of 3%, about the same as in countries like Germany and France.
In 2023, US health insurance companies were generally required to pay out at least 80% of the premiums they collected toward medical care and quality improvement activities under the Medical Loss Ratio rule, commonly referred to as the “80/20 rule.” This rule applied to individual and small group plans. For larger groups, insurers were required to allocate at least 85% of the premiums to these areas, with the remainder going to administrative costs, marketing, and profits. If insurance companies fail to meet these targets, they must issue rebates to policyholders.
Presence of complexity: The US payment system is highly complex, given the presence of Medicare, Medicaid, the Veterans Administration, myriad private insurance companies, public service insurance, etc. Managing this complexity represents an enormous cost to physicians, hospitals, and other care providers. This factor is the largest driver of the cost of the US system.
To quote T. R. Reid in The Healing of America, “The administrative monstrosity we have built costs us a lot of money—by far the highest administrative costs of any health care system on earth. The US Government Accountability Office concluded that if the country could get the administrative costs of its medical system down to the Canadian level, the money saved would be enough to pay for health care for all the Americans who are uninsured.”
Other characteristics of our system contribute to higher costs, but in a smaller way:
Provider compensation: According to the same “Mirror, Mirror 2024” study referenced above, the US had higher provider health care compensation than the comparable 10 countries. Generalist compensation in the US in 2024 was $233,903. In 2023, average compensation for health care generalists in other countries was significantly lower. For example, in Germany, generalists earned around $183,000, while in the United Kingdom, the average was about $138,000. In France, generalists made around $98,000, and in Italy, they earned approximately $70,000. Compensation for specialists and nurses followed a similar pattern.
Drug prices: Any number of studies demonstrate that the US spends more per capita on prescription drugs than comparable countries do. In order to ensure that comparisons are accurate, studies also examine utilization. The US is not an outlier in the volume or types of drugs consumed; the primary driver, therefore, is higher prices. The US relies on the competitive marketplace to set drug prices, whereas countries with single payers negotiate prices at the national level. In the US, Congress specifically forbade Medicare from negotiating prices. As a result, US consumers literally subsidize the drug prices offered to the rest of the world.
Testing and prices for services: Comparison studies also find that the prices of services, tests, surgical procedures, and hospital stays are higher in the US than elsewhere. In their 2025 article “How Does Health Spending in the US Compare to Other Countries?”, Emma Wagner, Matthew McGough, Shameek Rakshit, and Cynthia Cox of the Kaiser Family Foundation examined and illustrated this across several relevant metrics.
Litigation: Studies show that the cost and frequency of medical malpractice litigation in the US are greater than in other comparable countries. As a result, doctors pay considerably more for malpractice insurance, expect to be sued multiple times during a career, and charge more for their services accordingly. Insurance costs for all consumers are higher as a result. A 2010 study at the Harvard School of Public Health found that medical liability costs added 2.4% to total medical spending in the US.Finally, the US Chamber of Commerce reports that Americans spend far more per person on the costs of litigation than any other country in the world.
Medical School Bottleneck: The “graduate medical education bottleneck” or “residency bottleneck” refers to a convergence of policies that limits the number of new physicians despite rising demand for health care. While medical schools are competitive, accepting only about 40% of applicants, the bigger choke point is residency training, which is required for independent practice. The number of residency positions is largely capped by federal Medicare funding limits set in 1997, and this cap has barely grown, even as medical schools have expanded class sizes. This mismatch means some graduates can’t advance, worsening physician shortages, especially in primary care and rural areas. The shortages contribute to long wait times, overworked doctors, and gaps in essential services. Fixing the problem requires increasing medical school capacity and funding more residency slots, but policymakers worry that simply adding doctors without reform could further raise health care costs.
How is health insurance purchased and paid for in the US?
As indicated above, private insurance companies are the primary method of administering non-government-provided health care. As a result, the appropriate question is, “How is insurance purchased?” As of 2023, according to census data:
53.7% of the US population obtained health insurance through their employer.
10.2% had private health insurance outside of employer-sponsored plans.
3.6% of Americans were covered by military or Veterans Administration health insurance.
8% of the population remained uninsured.
What do we know about the 8% of Americans who have no health care coverage?
When surveyed by the Kaiser Family Foundation in 2023, Americans without health insurance cite the following reasons:
Cost is too high, 64.2%
Lost job or changed employers, 22%
Lost Medicaid, 11%
Employer does not offer coverage or employee is ineligible for coverage, 8.5%
Family status change, 4%
In 2023, 26.1% of uninsured Americans cited “no need for health coverage” as a reason for not having insurance.
Of those who do not have insurance, 13% are unemployed, 77% have at least one full-time worker in the family, and 10% have a part-time worker in the family.
What are the consequences for those without health insurance?
First, Americans without health insurance obtain less preventive health care and may incur greater costs in the long run.
Second, Americans without health insurance rely on emergency room visits for general health care, which is an expensive and inefficient way to provide care.
Third, Americans without health insurance struggle to pay bills for the care they do receive. The Kaiser Family Foundation article by Wagner et al. quoted above estimated that in 2015, one million adults declared bankruptcy as a result of outstanding medical bills. They also found that 22% of Americans between the ages of 18 and 64 struggled to pay medical bills. Health care providers expend considerable effort collecting payment and managing write-offs, thereby raising the cost for all.
What is the history of health care reform efforts?
For decades, many US policymakers and public officials have made efforts to ensure that every citizen has access to health care.
During the Great Depression, President Roosevelt was deeply concerned about the state of American health care. He hoped to include nationalized health care in the Social Security Act, but retreated in the face of opposition from the American Medical Association.
During World War II, the government froze wages and prices to facilitate the war effort. Unable to compete for employees based on wages, employers began to offer health insurance as a benefit not subject to price controls. As employer-provided health care developed and health care costs increased, retirees were increasingly unable to afford care. Those working in low-wage professions also struggled, as typically such employers did not provide coverage. As a result, President Johnson proposed and passed the Medicare and Medicaid programs in 1965 to provide coverage to retirees and low-income citizens.
Ever since, policymakers have struggled to standardize health care for US citizens. In 1971, Senator Kennedy proposed a form of universal health care. President Nixon also had proposals in process, but these were derailed by Watergate. President Clinton tried again unsuccessfully in 1992. Finally, in 2010, President Obama passed the Affordable Care Act (ACA). As discussed below, however, the ACA did not provide single-payer universal coverage, but settled for expanding access to Medicaid and private insurance.
What was the ACA and how did it work?
In America’s Bitter Pill, Steven Brill articulated the elements of the health care debate that resulted in the 2010 passing of the ACA. Brill wrote that generally, policymakers recognized two broad challenges in the US health care system: cost and access. First, Americans pay considerably more for health care than other countries. Second, a significant portion of Americans lack access to health care for reasons that include cost, pre-existing conditions, and loss of employer coverage.
Policymakers also recognized that the US could not afford to provide insurance to all Americans at 18% of GDP. But, if we could reduce costs to the levels seen in other countries, we could provide health care just as they did. Standing in the way of cost reduction, however, was a host of special interests, including the AMA, the insurance industry, the bar association, medical equipment manufacturers, and pharmaceutical companies.
Concluding that significant progress on the cost front was unrealistic, the Obama administration settled for a complicated mix of small cost concessions from the major special interests, increasing taxes on individuals and equipment manufacturers, adding a pre-existing condition exclusion, creating a national exchange, and expanding Medicaid.
More specifically, the ACA did the following:
Required individuals who did not receive health insurance benefits through their employers to purchase coverage or pay a penalty. The theory was that if everyone (including the relatively healthy) purchased insurance, the average cost for everyone would decline.
Created subsidies to help low-income families pay for health insurance.
Implemented strict guidelines for insurers: they could not cancel policies when a policyholder became sick, place a lifetime monetary limit on benefits deemed "essential" in new policies, deny coverage because of pre-existing conditions, or enforce higher premiums within the same age/geographical group because of gender or pre-existing conditions (besides tobacco use).
Created the Health Insurance Marketplace, which provides easier access to plans for both businesses and individuals.
Expanded Medicaid eligibility to those earning 133% of the federal poverty level.
Prohibited employers from making their employees wait more than 90 days for health insurance eligibility.
Implemented a penalty of $2,000 per employee on employers who did not provide health insurance for those who already had coverage before the ACA.
Required coverage of certain types of preventative care at no additional cost to the patient.
Prohibited annual and lifetime dollar limits on care.
What were the overall outcomes of the ACA?
A Commonwealth Fund report discusses immediate outcomes in the years after the ACA was passed. By the end of the 2016 enrollment period, 12.7 million Americans were covered under state and federal exchange plans, and the percentage of uninsured Americans declined by about 5%. The probability of people not receiving necessary medical care decreased by 20-25%, and the probability of people having a usual place of care increased by 47.1-86.5%.
While the ACA successfully expanded access to health care, however, it fell short in reducing cost. The primary reason for this was that major providers did not provide reasonable concessions. Another reason is that the minimum viable policy of the ACA was more expensive than policies people had access to prior to the ACA.
What is the current state of the ACA?
In July 2017, the Republican Party attempted but failed to repeal the ACA. Since that time, they have passed a provision repealing the individual mandate in an effort to weaken the program.
In his first term, President Trump signed an executive order asking federal agencies to make new rules for cheaper, bare-bones health plans. He also reduced (where possible) government subsidies known as “cost-sharing reductions,” which reimburse insurers for discounts they give to policyholders with incomes under 250% of the federal poverty line (or about $30,000 in income a year for an individual). These discounts shield lower-income customers from out-of-pocket expenses such as deductibles and copayments. These subsidies have been the subject of a lawsuit that is ongoing.
The first Trump administration’s impact on the ACA also included eliminating the Small Business Health Options Program (SHOP) marketplace, shifting responsibility to the states to offer provider networks and access to community providers, eliminating agreed-upon compensation to insurers for subsidized individuals, and an effort by the Department of Justice to legally invalidate the pre-existing condition exclusion.
What is the mix of private versus public funding in the US versus other countries?
Another way to look at health care spending in the US is to review how the mix of public and private spending compares to other countries. According to the Kaiser Family Foundation article referenced above, public health care spending in the US was 16.4% of GDP in 2022—roughly equal to publichealth care spending in Germany, the United Kingdom, France, Belgium, Austria, Canada, and Switzerland. The difference is that public spending in these countries enables coverage for all citizens. In effect, the private sector in the US makes up the amount by which US total health care spending exceeds that of comparable countries.
What does healthcare look like in some of the countries setting an example for affordable and accessible healthcare?
France: France’s health care system is widely regarded as one of the best in the world for access, quality, and patient satisfaction, according to OECD and other international comparisons. France performs near the top on most major health care outcomes while providing coverage to virtually every resident. On average, French residents visit a doctor more frequently than Americans, and per-capita prescription drug use is also higher.
Several aspects of the French system resemble the US model: care is delivered by a mix of private doctors and a combination of public and private hospitals, and most employed individuals receive insurance through their employers with payroll contributions. The similarities, however, end there.
In France, the number of insurance schemes is limited, with each tied to a resident’s region or occupation and defined by the government. If someone loses their job, coverage continues, with the state covering the employer’s share. Pre-existing conditions are not grounds for exclusion. Prices for services are regulated, drug prices are negotiated nationally, and patients are informed of costs in advance. As a result, providers generally earn less than their US counterparts, and hospitals operate more efficiently and at lower cost. Health records are increasingly digitized, and the national health card streamlines billing so payments are processed automatically at the end of appointments. Administration is handled by nonprofit insurance entities with minimal overhead, as they do not underwrite policies, deny claims, or seek profits.
The result is that France delivers high-quality care to all residents while keeping per-capita health spending far below US levels.
Germany: Germany’s health care system continues to be ranked among the top systems globally. It spends 12% of GDP on health care, significantly less than the US’s 18%.
Like France, Germany regulates prices for health care services and pharmaceuticals, resulting in lower provider compensation than in the US. Coverage is provided through employer-based insurance, with employers and employees sharing costs. Unlike France’s limited number of plans, Germany offers nearly 250 different sickness funds, which are nonprofit, regionally or occupationally based insurance entities that compete for enrollees. Any resident can choose or change funds at any time, independently of employer ties, and mandatory coverage continues even if someone loses their job, with the government covering the employer’s contribution.
Sickness funds provide coverage to virtually all residents, except those above a certain income threshold, who may opt into the private insurance market. Administration costs are notably low—estimated at one-third of the US level—thanks to streamlined operations and nonprofit management.
Japan: As of the latest figures, Japan spends 10.8% of its GDP on health care, significantly below the US. Despite this, Japanese citizens benefit from better outcomes and frequent access.
Health care delivery mirrors the models in Germany and France, relying predominantly on private providers. However, Japan tightly regulates costs through a nationally controlled fee schedule, ensuring standardized pricing and universal access.
Health insurance coverage flows through a system of over 3,500 community-, occupation-, or employer-based plans, assigned based on employment or residency status rather than chosen freely. Large employers directly provide insurance; small businesses and the self-employed receive government subsidies; and the state supports coverage for the unemployed, elderly, and others in need. Individuals pay a reasonable share of costs, with protective maximums. Coverage is mandatory and includes preexisting conditions, and insurers are obligated to pay all submitted claims.
Australia: Strong health outcomes in Australia include an average life expectancy of 83.3 years in 2022, among the highest globally. Australia also has the highest life expectancy after age 60 (25.6 years of additional life expectancy). The country operates a dual system where approximately 47% of the population holds private health insurance alongside universal Medicare coverage. Australia's infant mortality rate stands at 3.1 deaths per 1,000 live births, well below the OECD average.
The Australian Medicare system covers about 75% of the cost of most medical services, with the Pharmaceutical Benefits Scheme subsidizing prescription medications. Health care spending represents 9.9% of Australia's GDP, which is moderate compared to other developed nations. The country demonstrates strong performance in preventable mortality rates and consistently ranks in the top tier for health care accessibility and equity measures.
The Netherlands: The Dutch maintain an average life expectancy of approximately 82.2 years while operating one of the most cost-effective health care systems among developed nations. Health care spending per capita is approximately $6,518, representing about 10.9% of GDP, which provides excellent value relative to outcomes achieved. The Dutch system achieves coverage of 99.9% of the population through mandatory insurance, with government subsidies ensuring affordability for lower-income residents. The infant mortality rate is among the lowest globally, at 3.6 deaths per 1,000 live births.
The Netherlands demonstrates superior performance in care coordination metrics, with over 95% of patients reporting easy same-day access to primary care when needed. Preventable mortality rates are significantly lower than the OECD average, and the country consistently achieves top rankings for patient-reported experience measures. Administrative costs represent only 3.3% of total health expenditures, demonstrating operational efficiency. The managed competition model results in stable premium increases averaging 2-3% annually, well below medical inflation rates seen in other countries.
United Kingdom: The UK delivers comprehensive health care through its National Health Service (NHS) while maintaining low per capita spending compared to other developed nations. In 2021, the United Kingdom spent $5,387 per capita on health care, representing 11.9% of its GDP. This level of spending is considered notably efficient given the comprehensive range of services provided through the NHS.
Average life expectancy is 81.2 years, with infant mortality rates at about 4.4 deaths per 1,000 live births. The United Kingdom achieves strong performance in equity measures, with healthcare access showing minimal variation based on income or geographic location. Preventable mortality rates have improved significantly over the past decade, though waiting times for elective procedures remain a challenge, with median wait times of approximately 14 weeks for non-urgent specialist treatment.
The NHS employs roughly 1.7 million people, making it one of the world's largest employers, and maintains a primary care system with over 6,500 general practices serving as gatekeepers to specialist care. Health care spending is predominantly public (approximately 79% of total health expenditure), ensuring universal access free at the point of use. Cancer survival rates have improved substantially, with five-year survival rates for major cancers now approaching or exceeding European averages.